You can analyze budget data in Dashboards and Custom Reports using either the Budget or Project source, depending on the information you want to report on.
- Custom pivot reports: When using Budget as the source, add Project Budget under Values to report on budgeted amounts.
- Dashboard cards and chart widgets: When using Budget as the source, select Budgeted amount or Project Budget to summarize or plot budget values.
Create a budget card widget
- Open Dashboard from the sidebar.
- Select Add new widget.
- Choose Add card, then select Next.
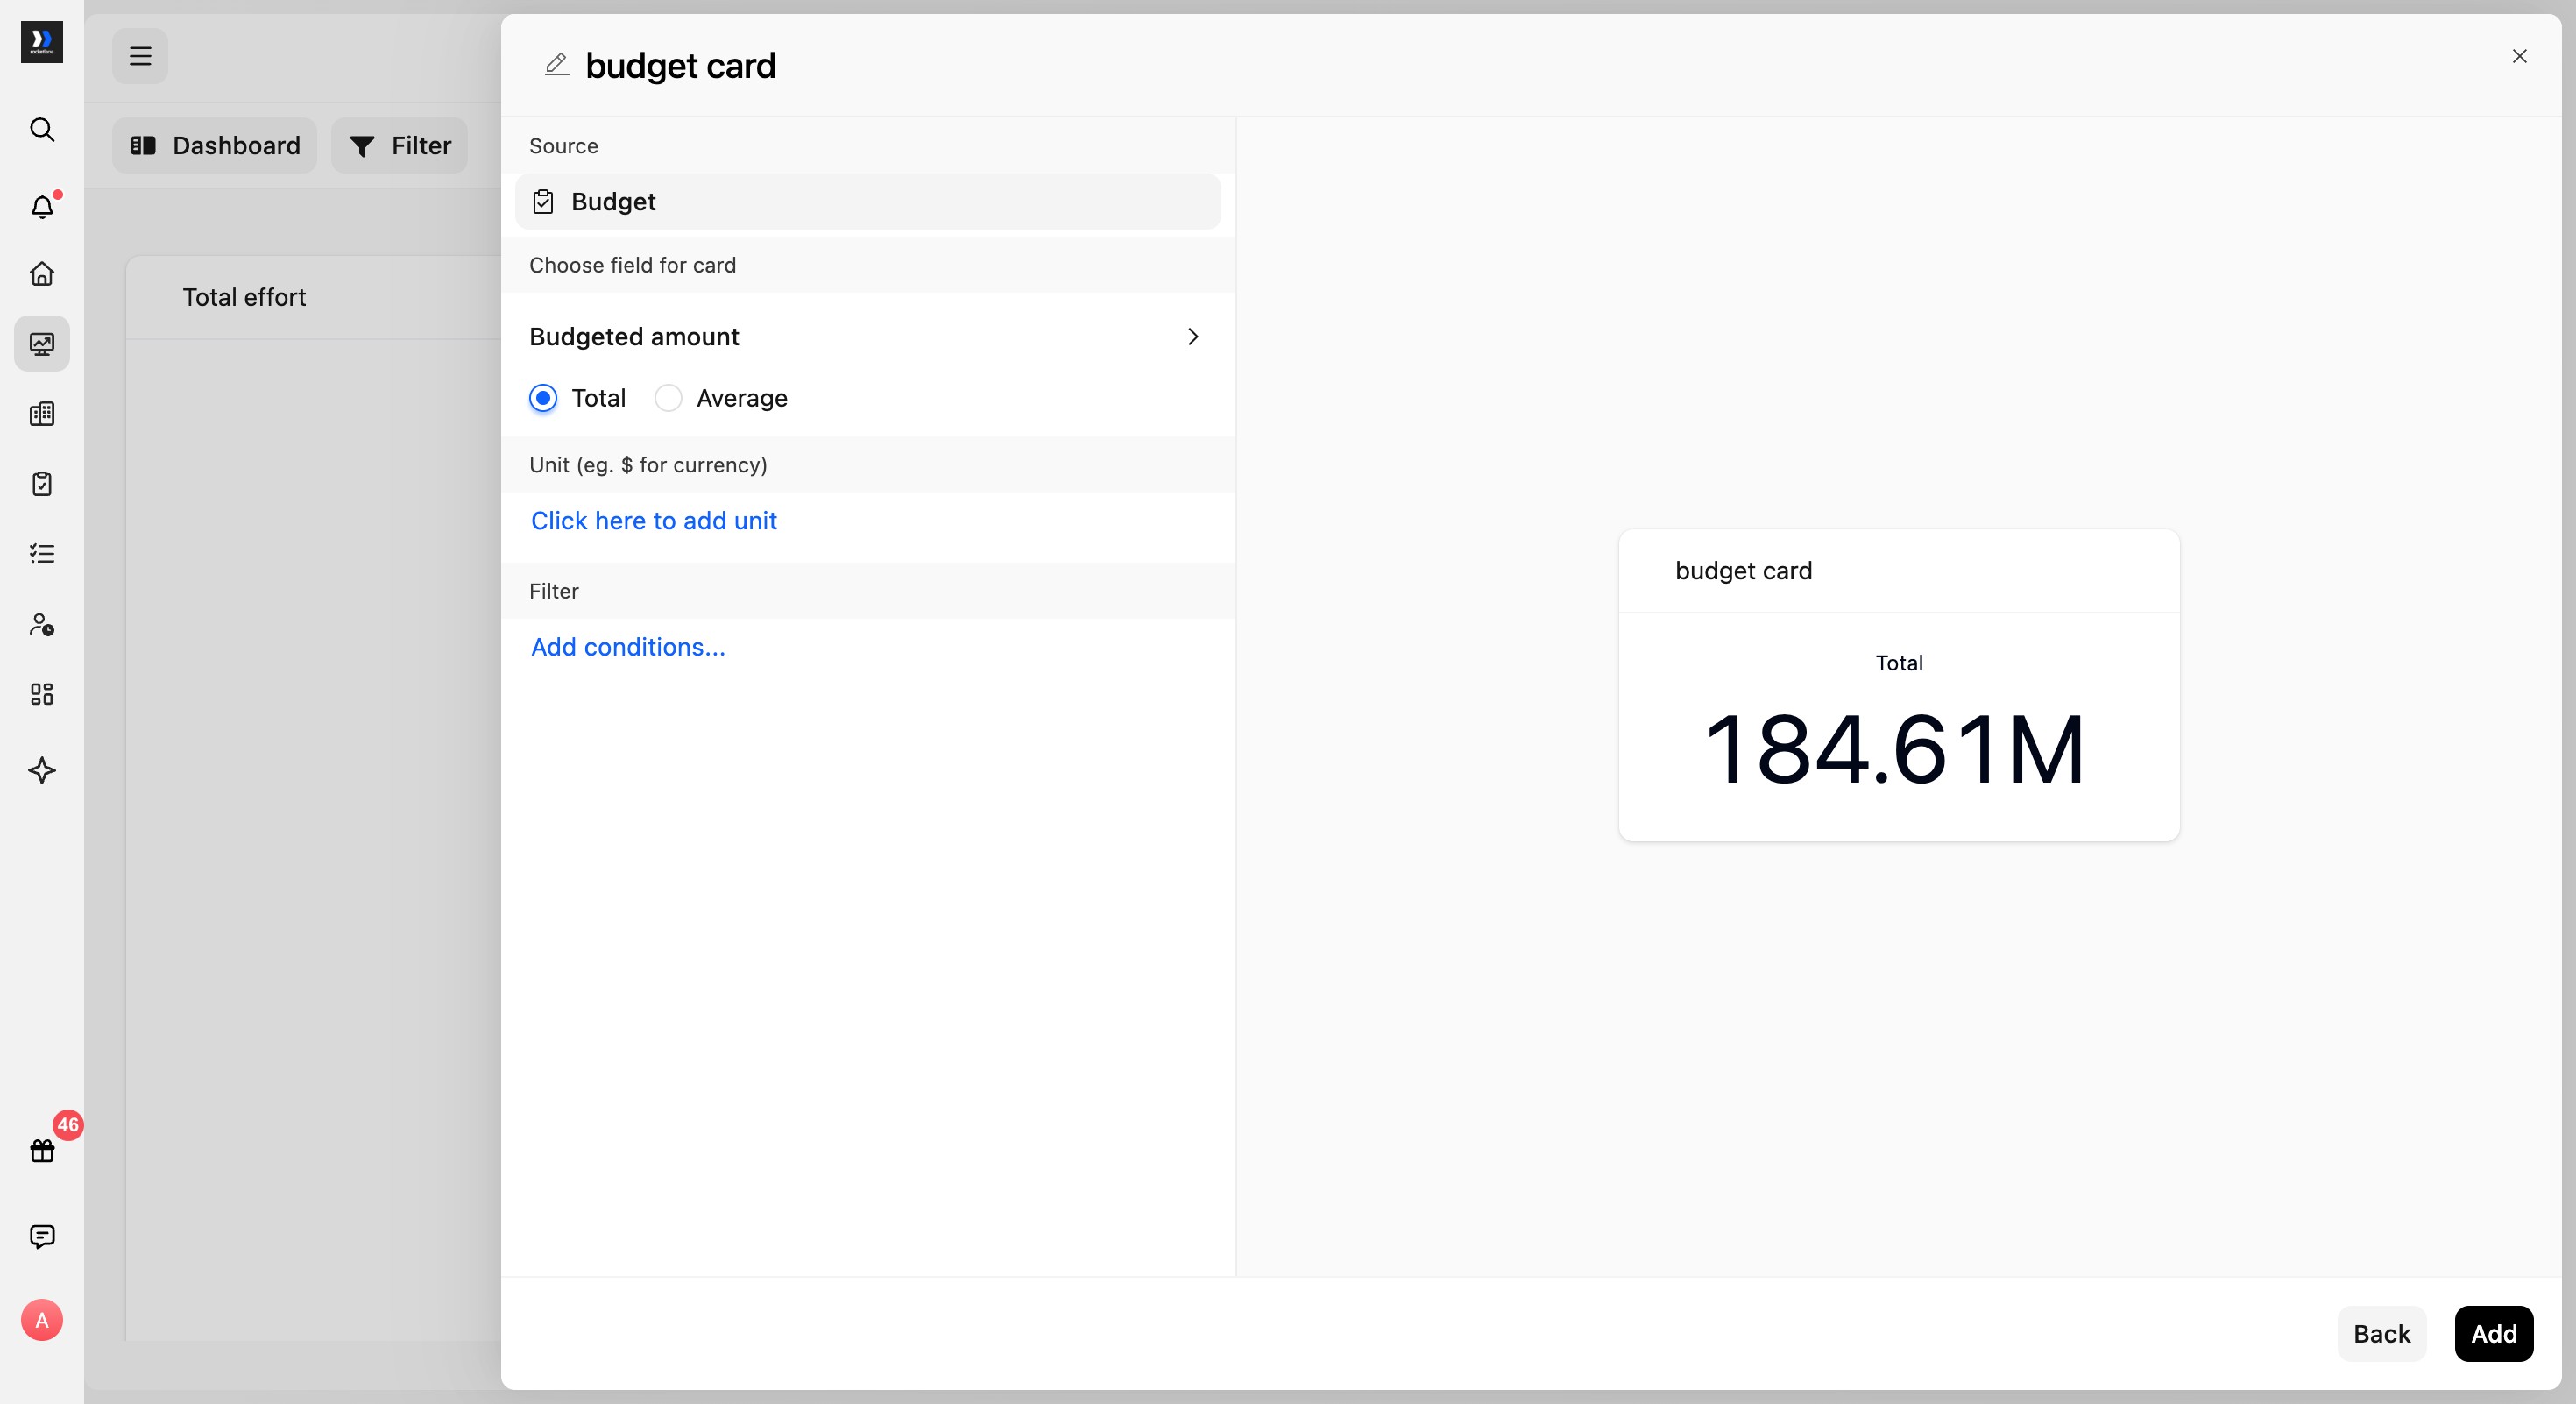
- Enter a name for the widget and set Source to Budget. Keep Budgeted amount selected to display the total budgeted amount.
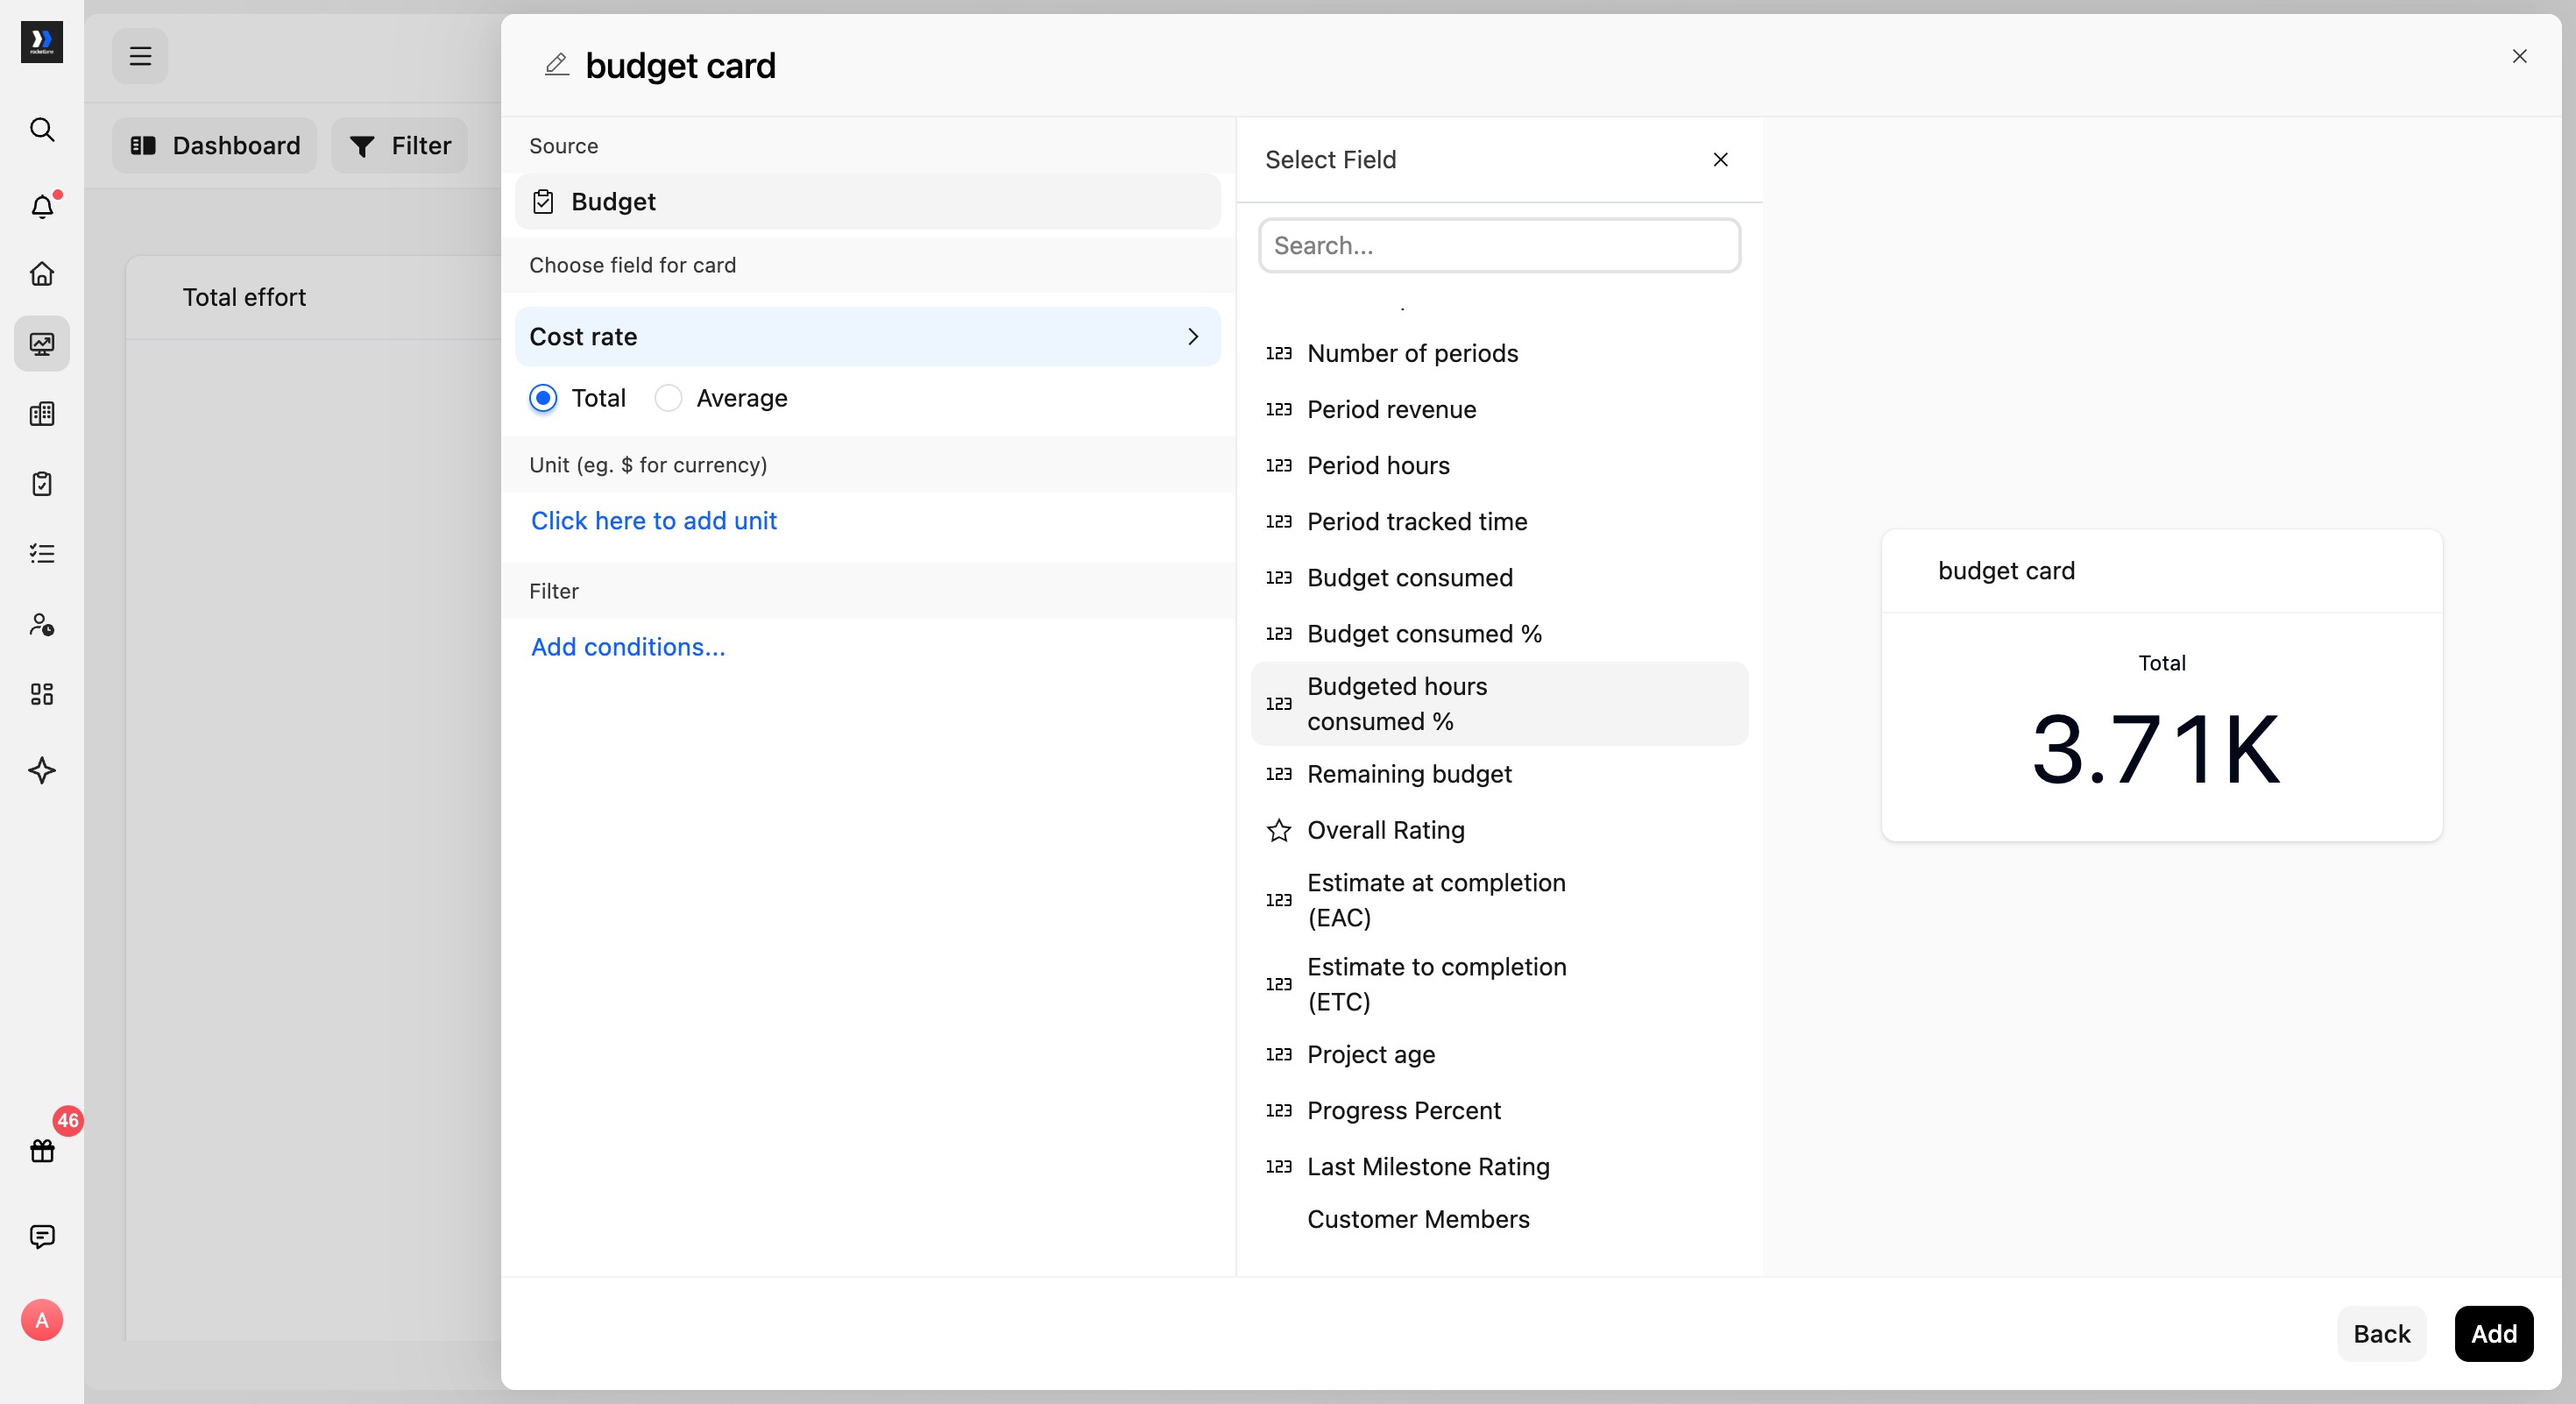
- To display another metric, open Choose field for card and select a field such as Budgeted hours consumed %.
- Select Add to save the card widget to the dashboard.
Create a budget chart widget
- From the Dashboard page, select Add new widget.
- Choose Add chart, then select Next.
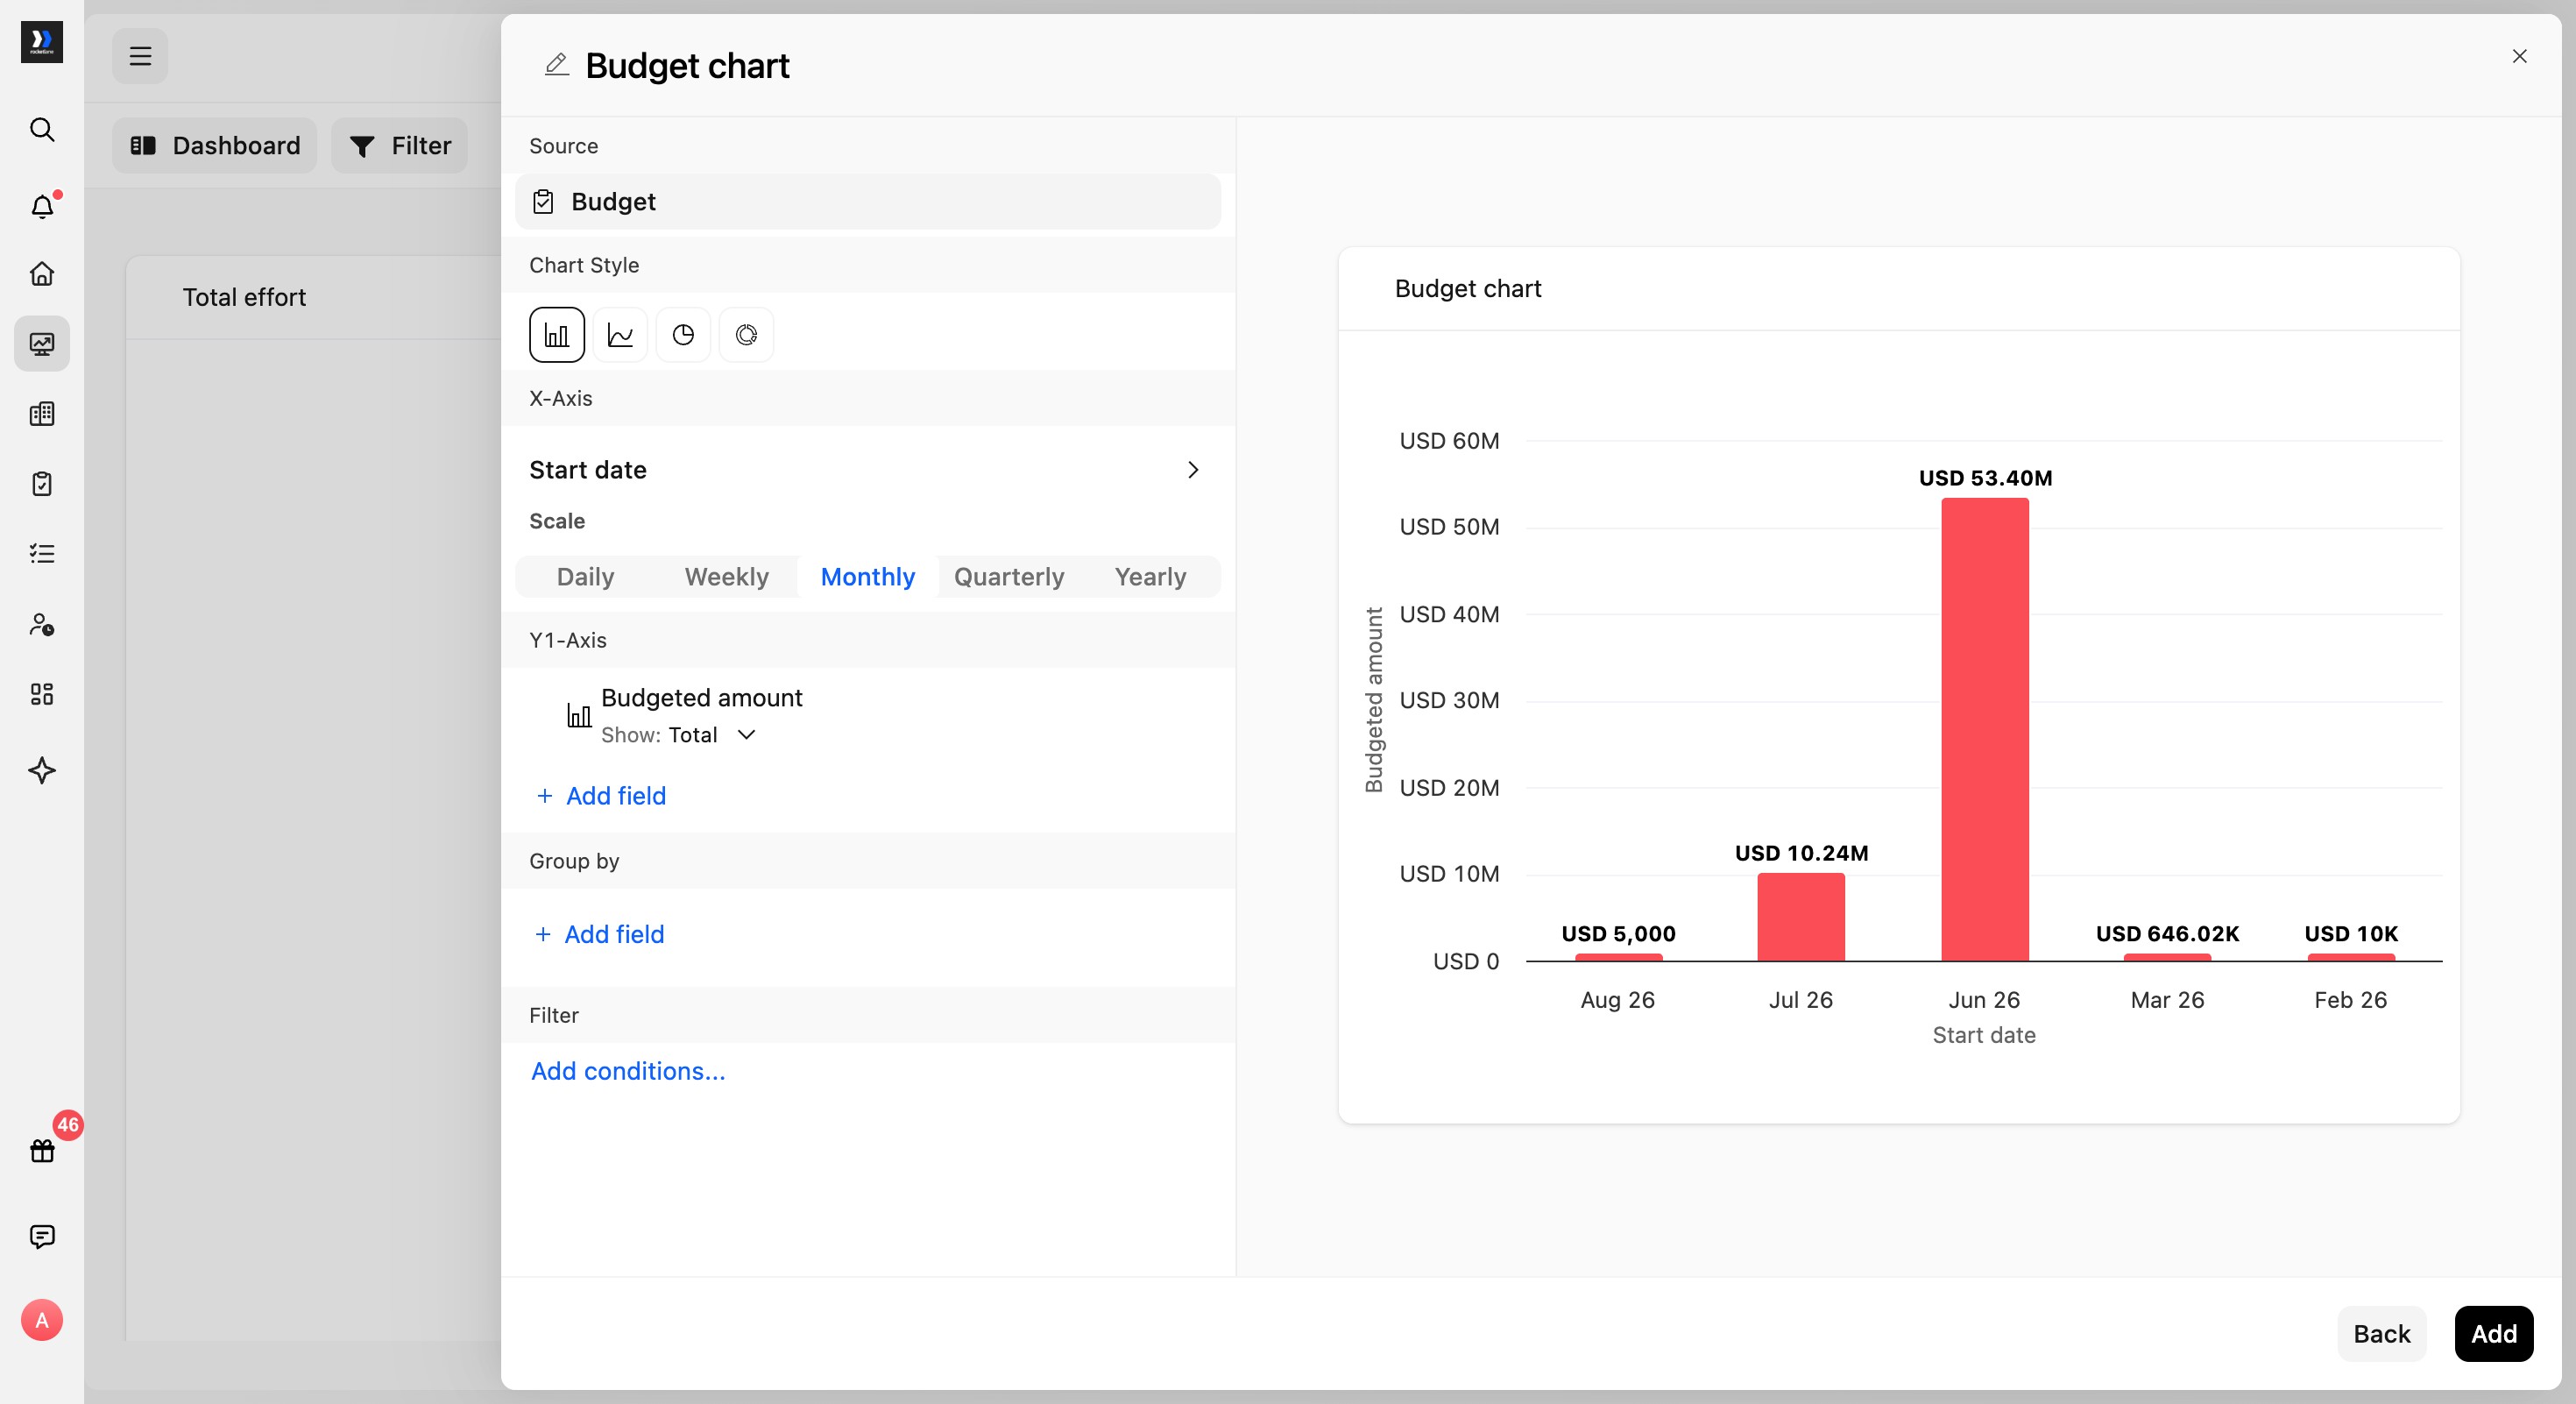
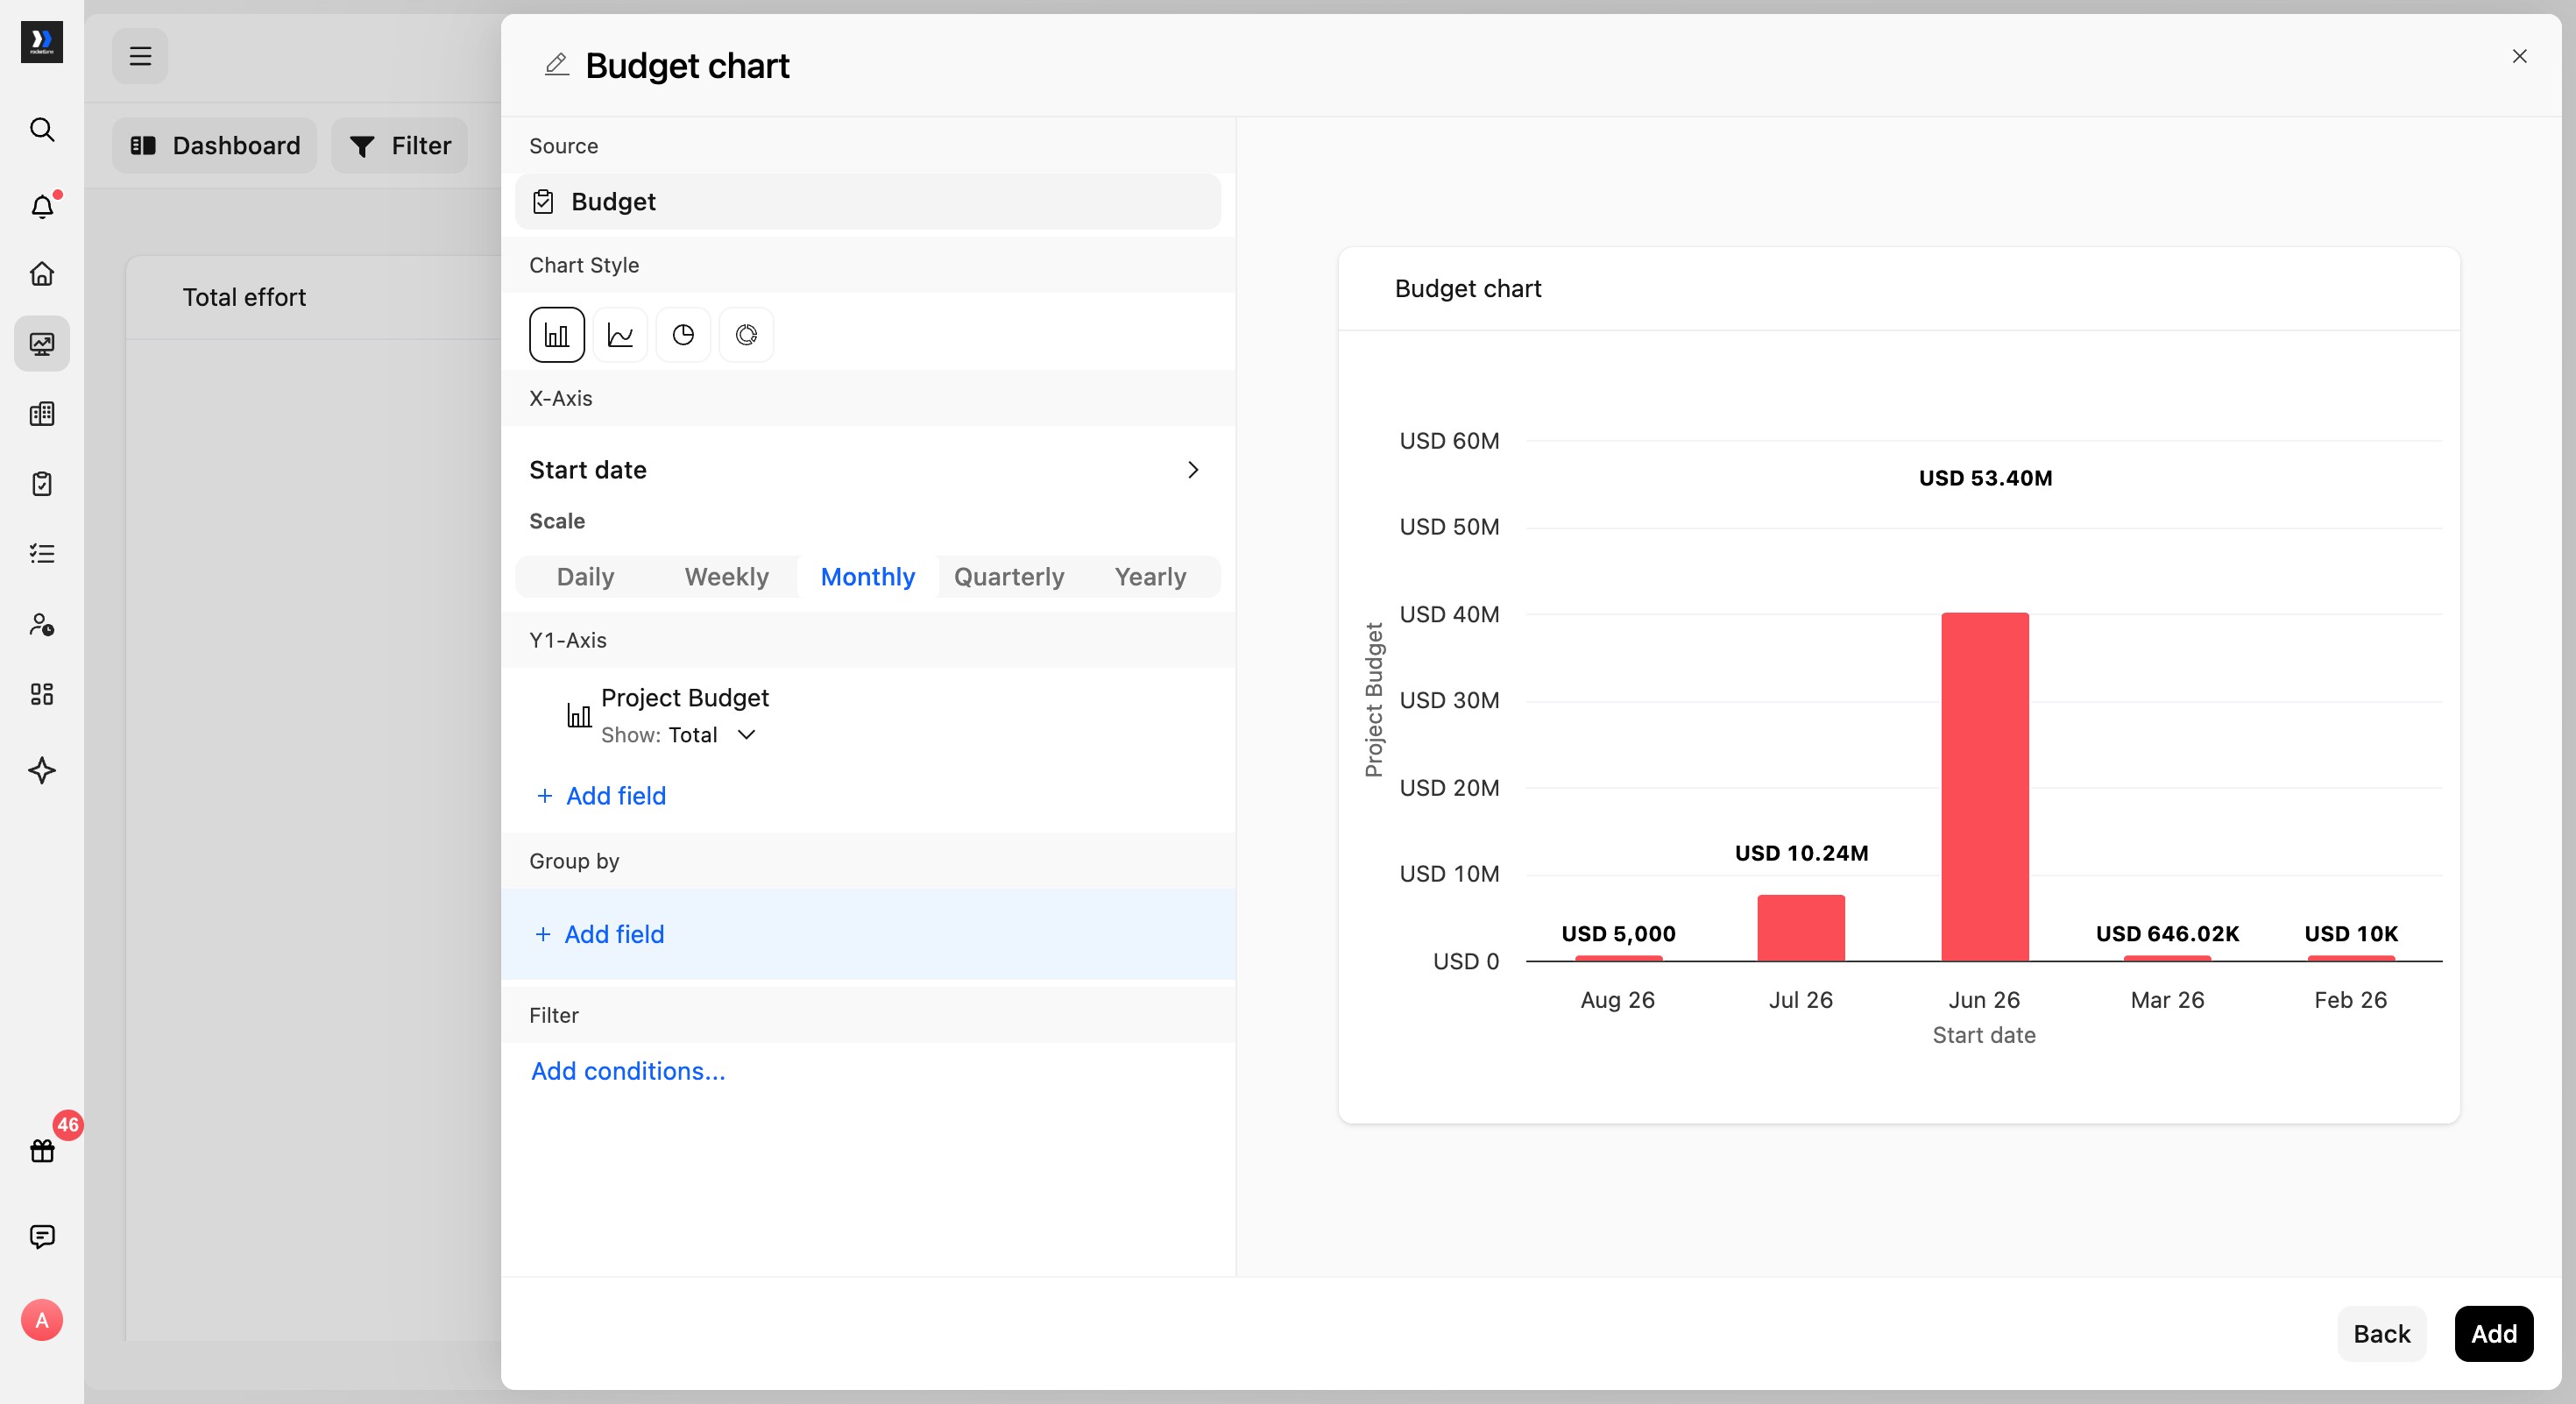
- Enter a name for the widget and set Source to Budget. The default configuration plots the total Budgeted amount by month.
Analyze the number of budgets
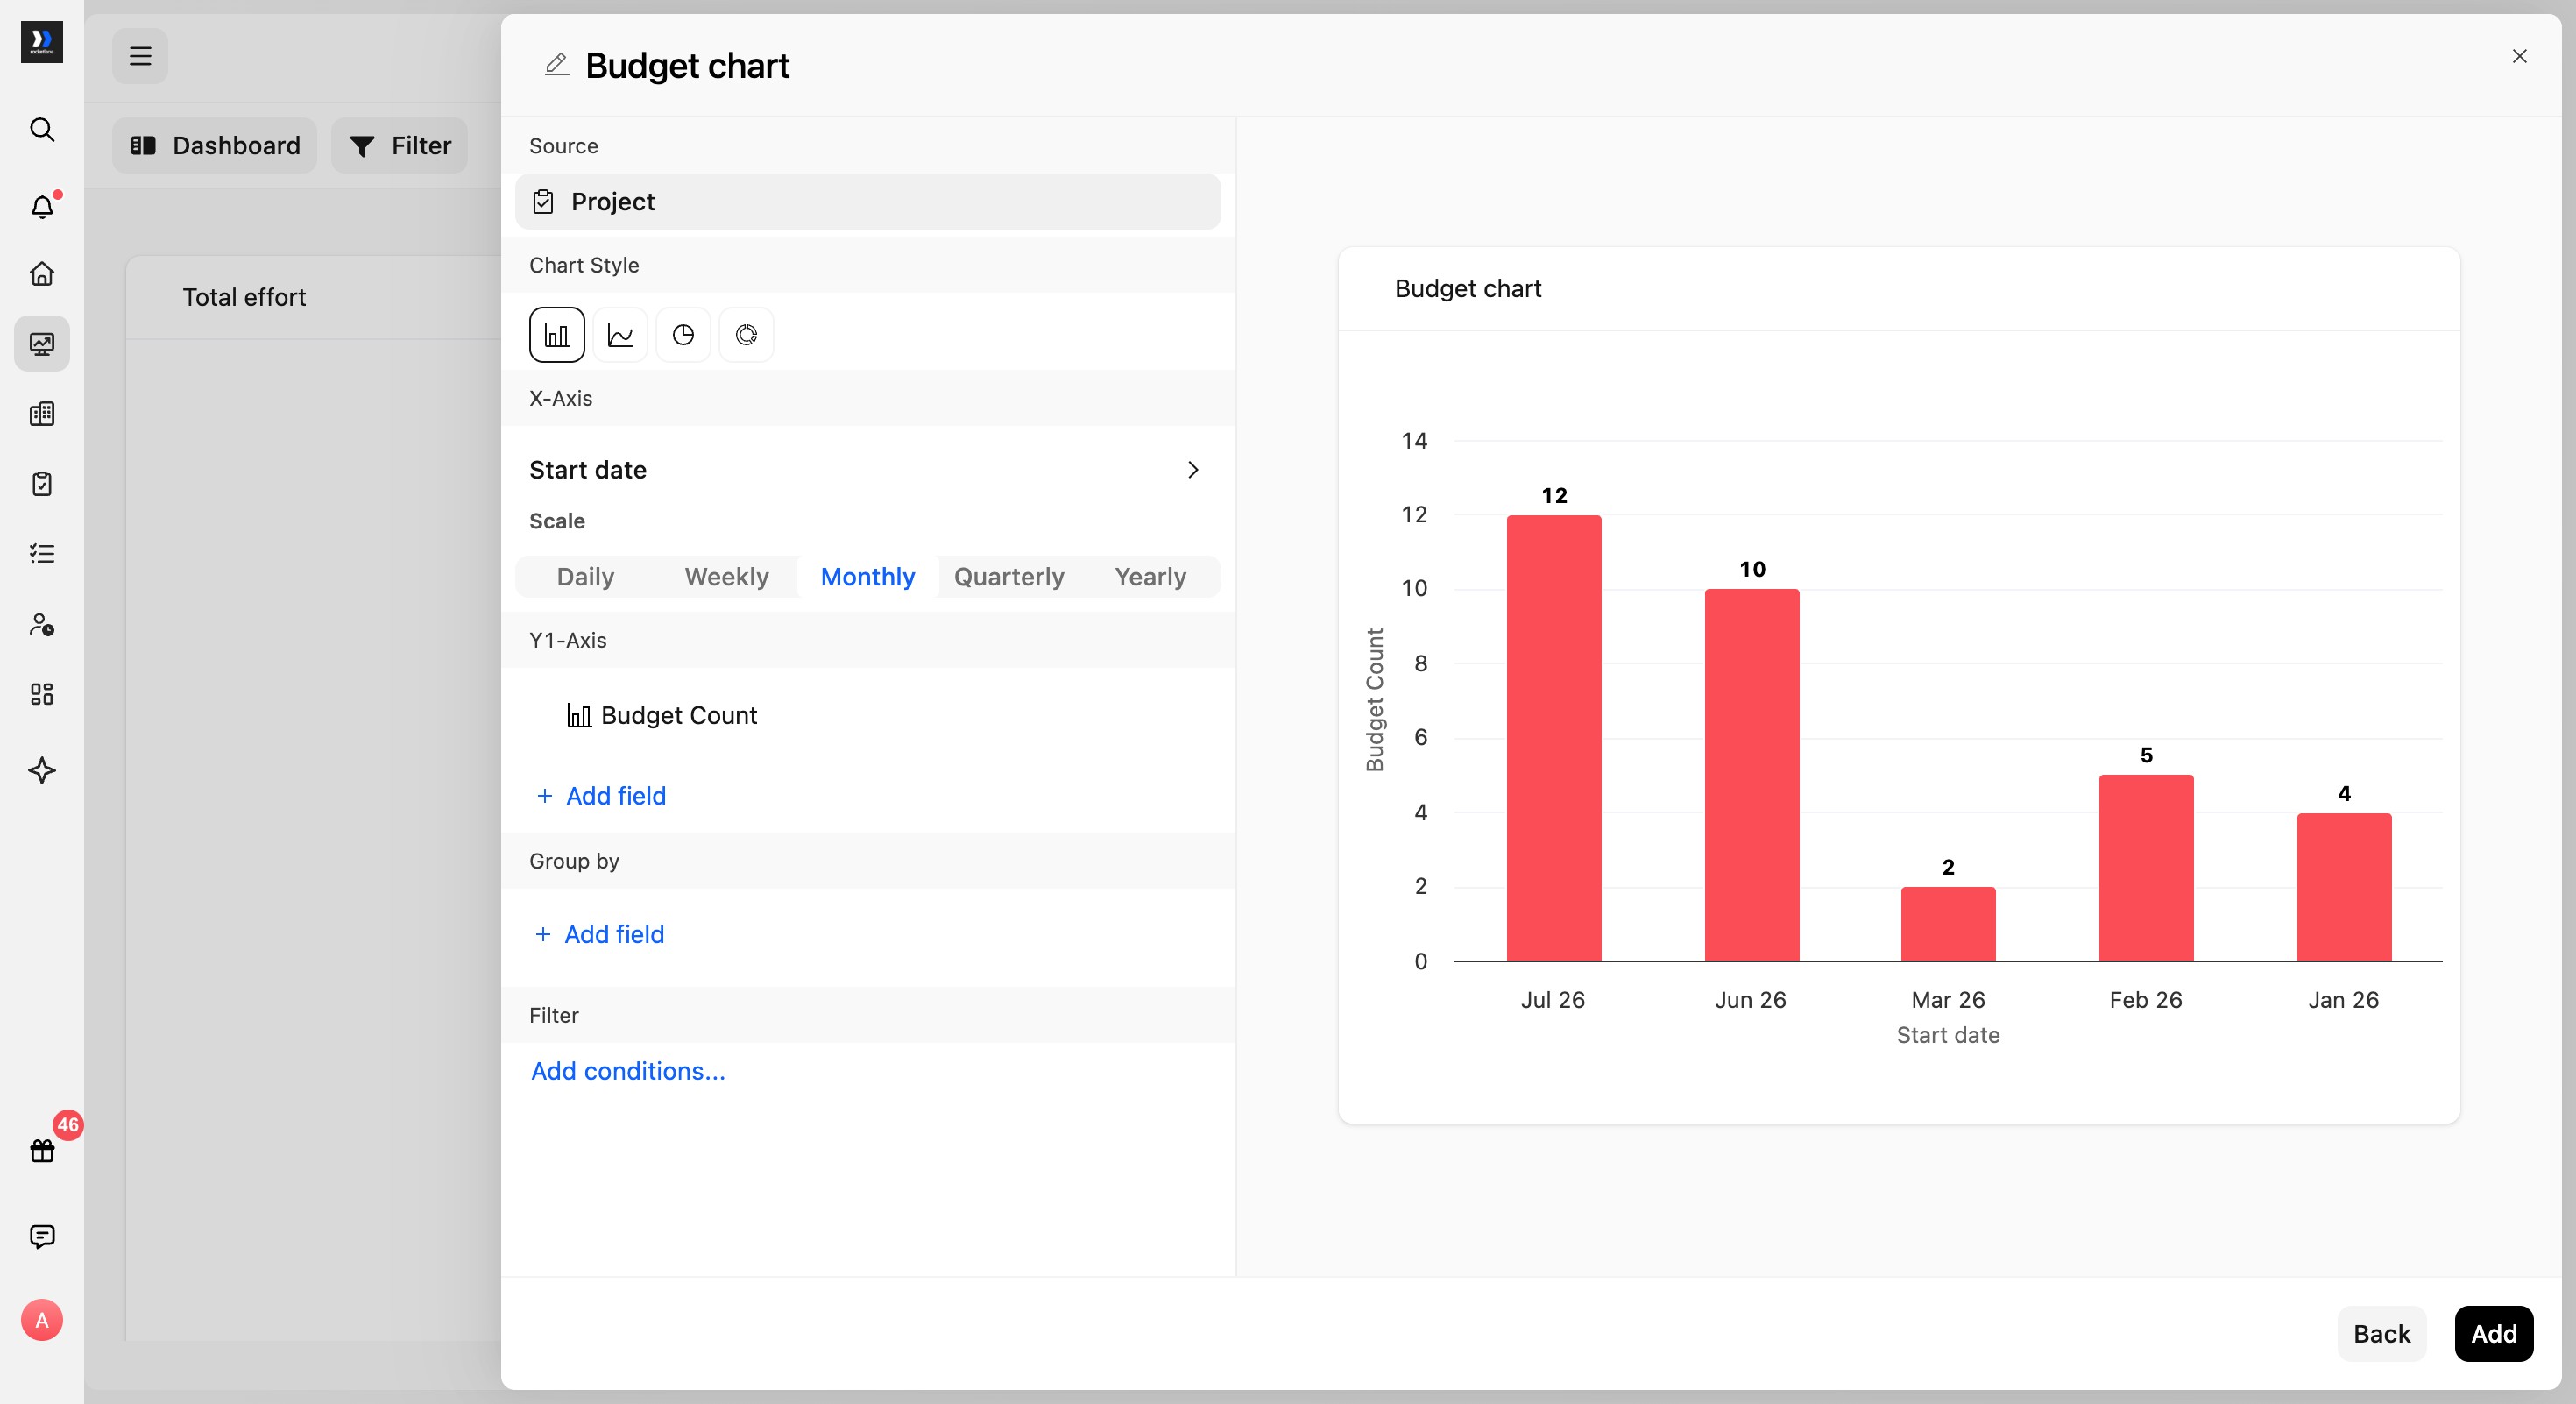
- Change Source to Project.
- Select Budget Count from the field picker.
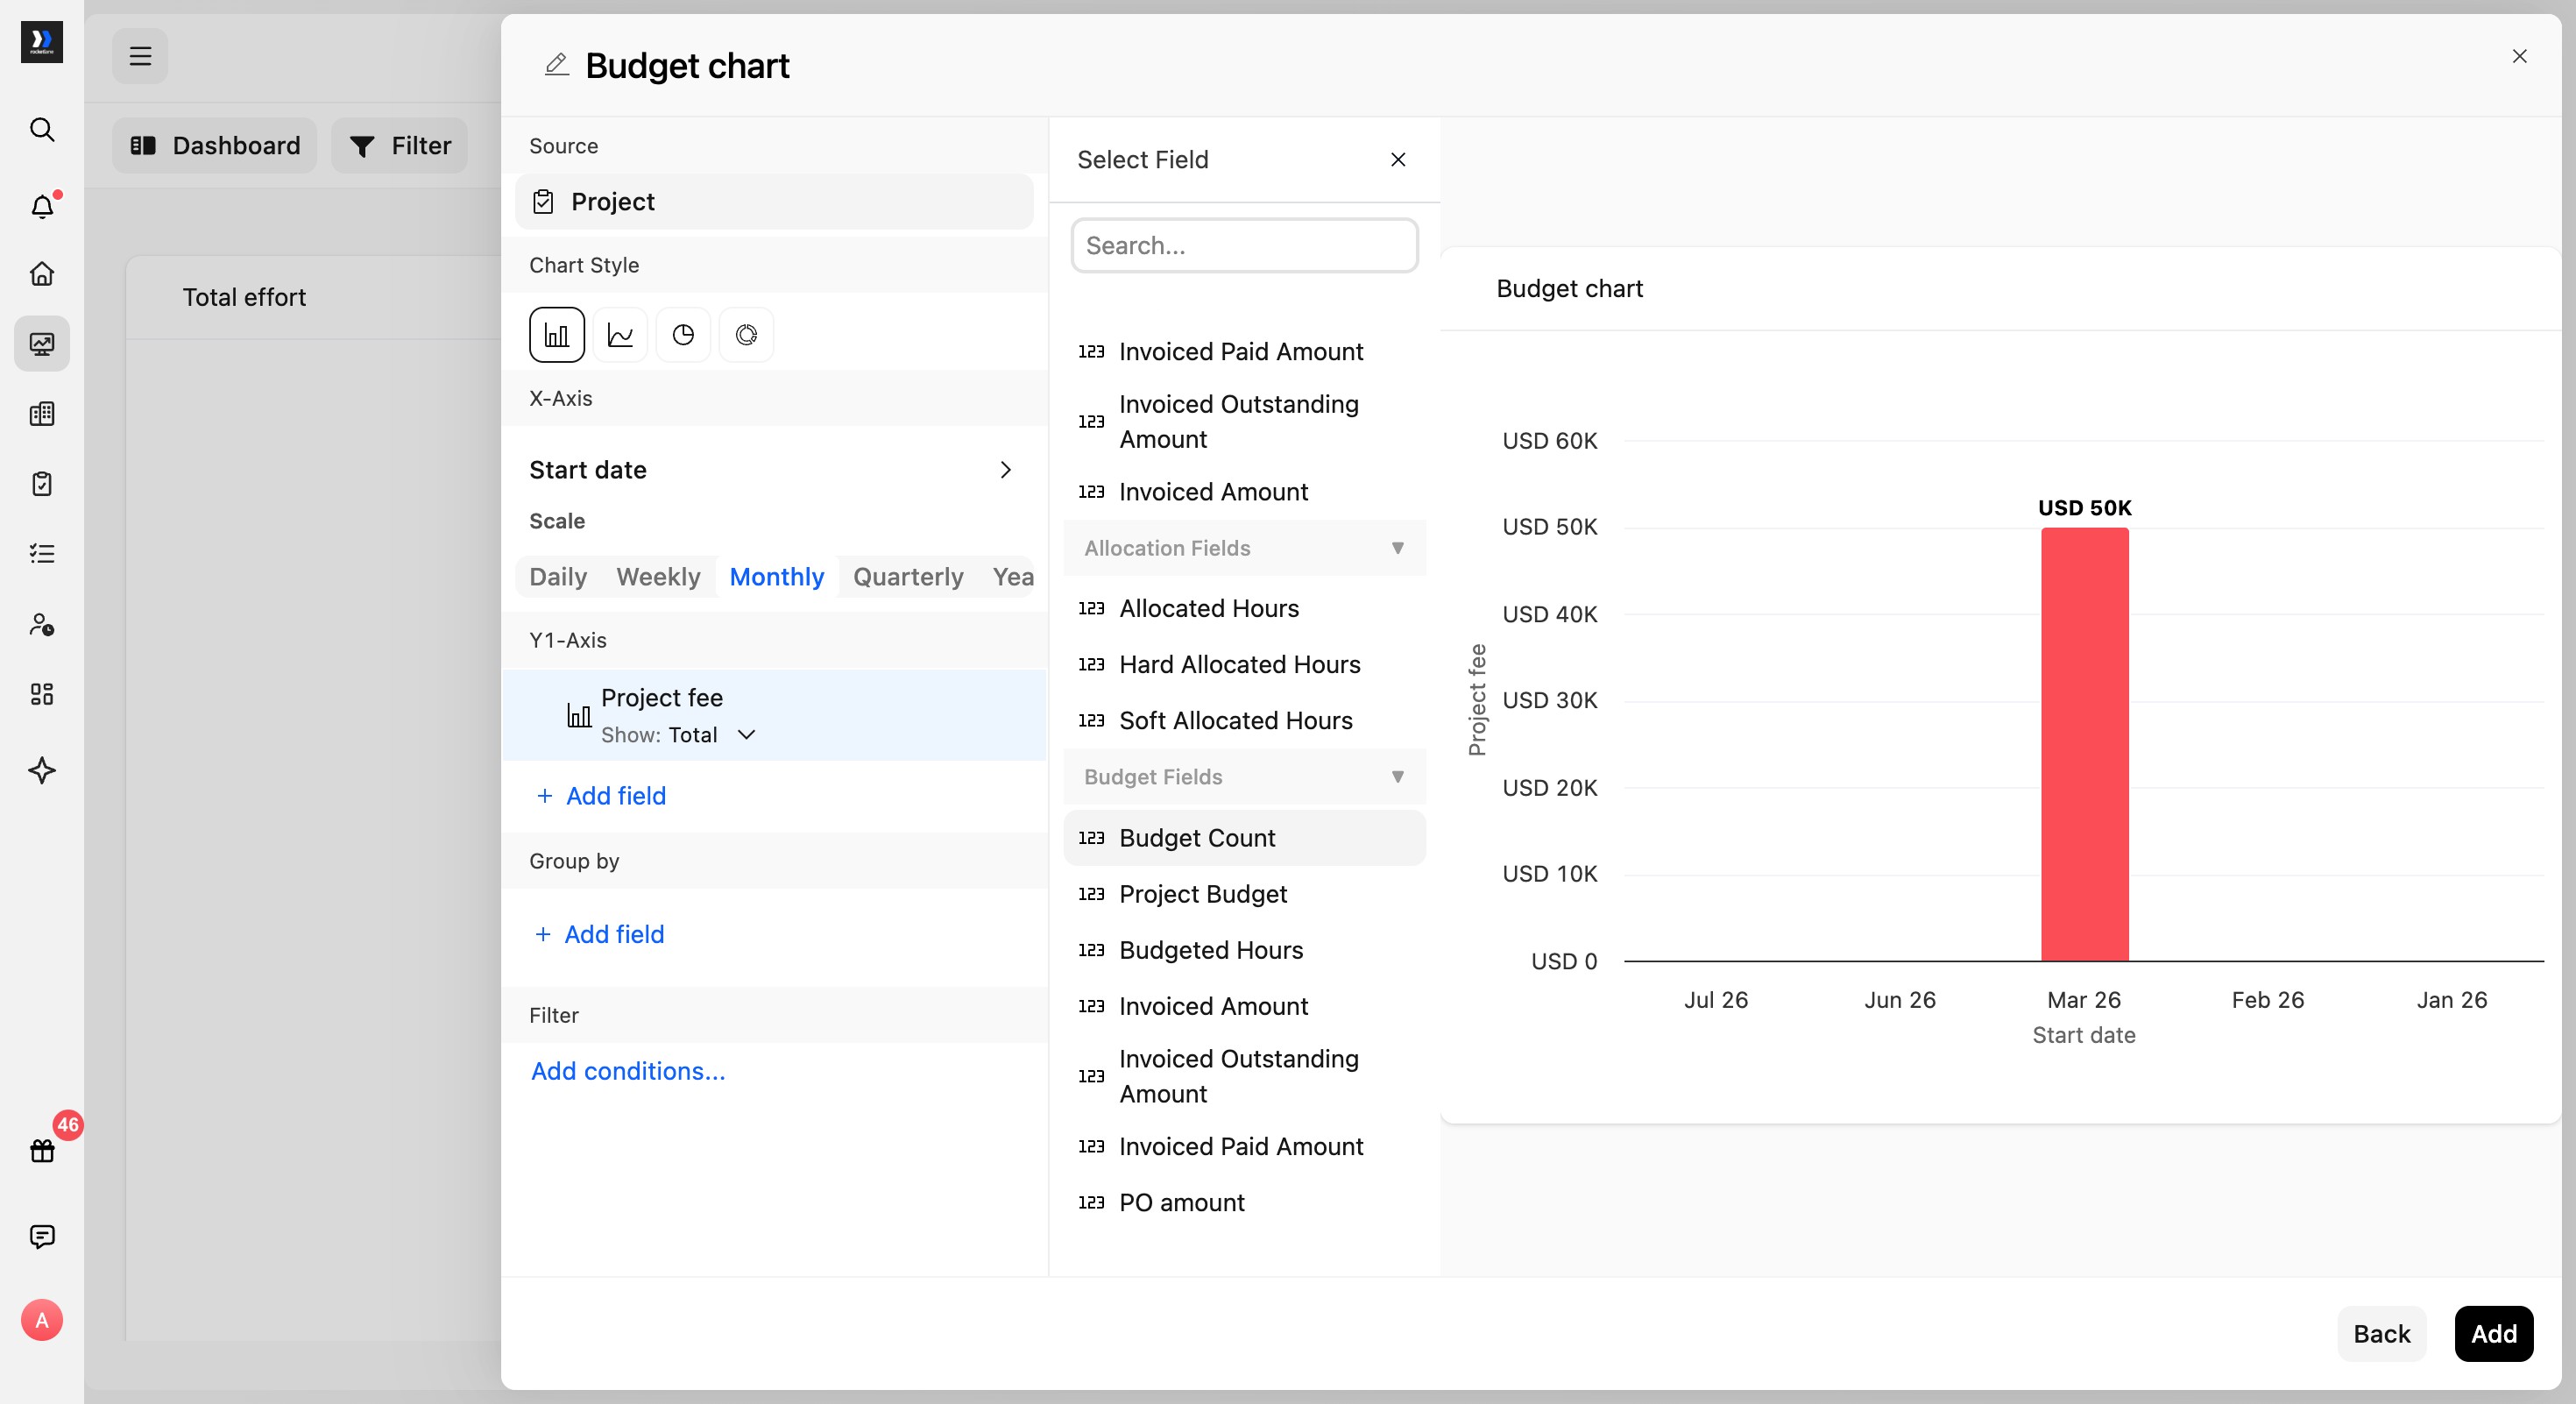
The chart displays the number of budgets in each monthly period.
Analyze budget values by status
- Change Source back to Budget.
- For the Y1-Axis, select Project Budget.
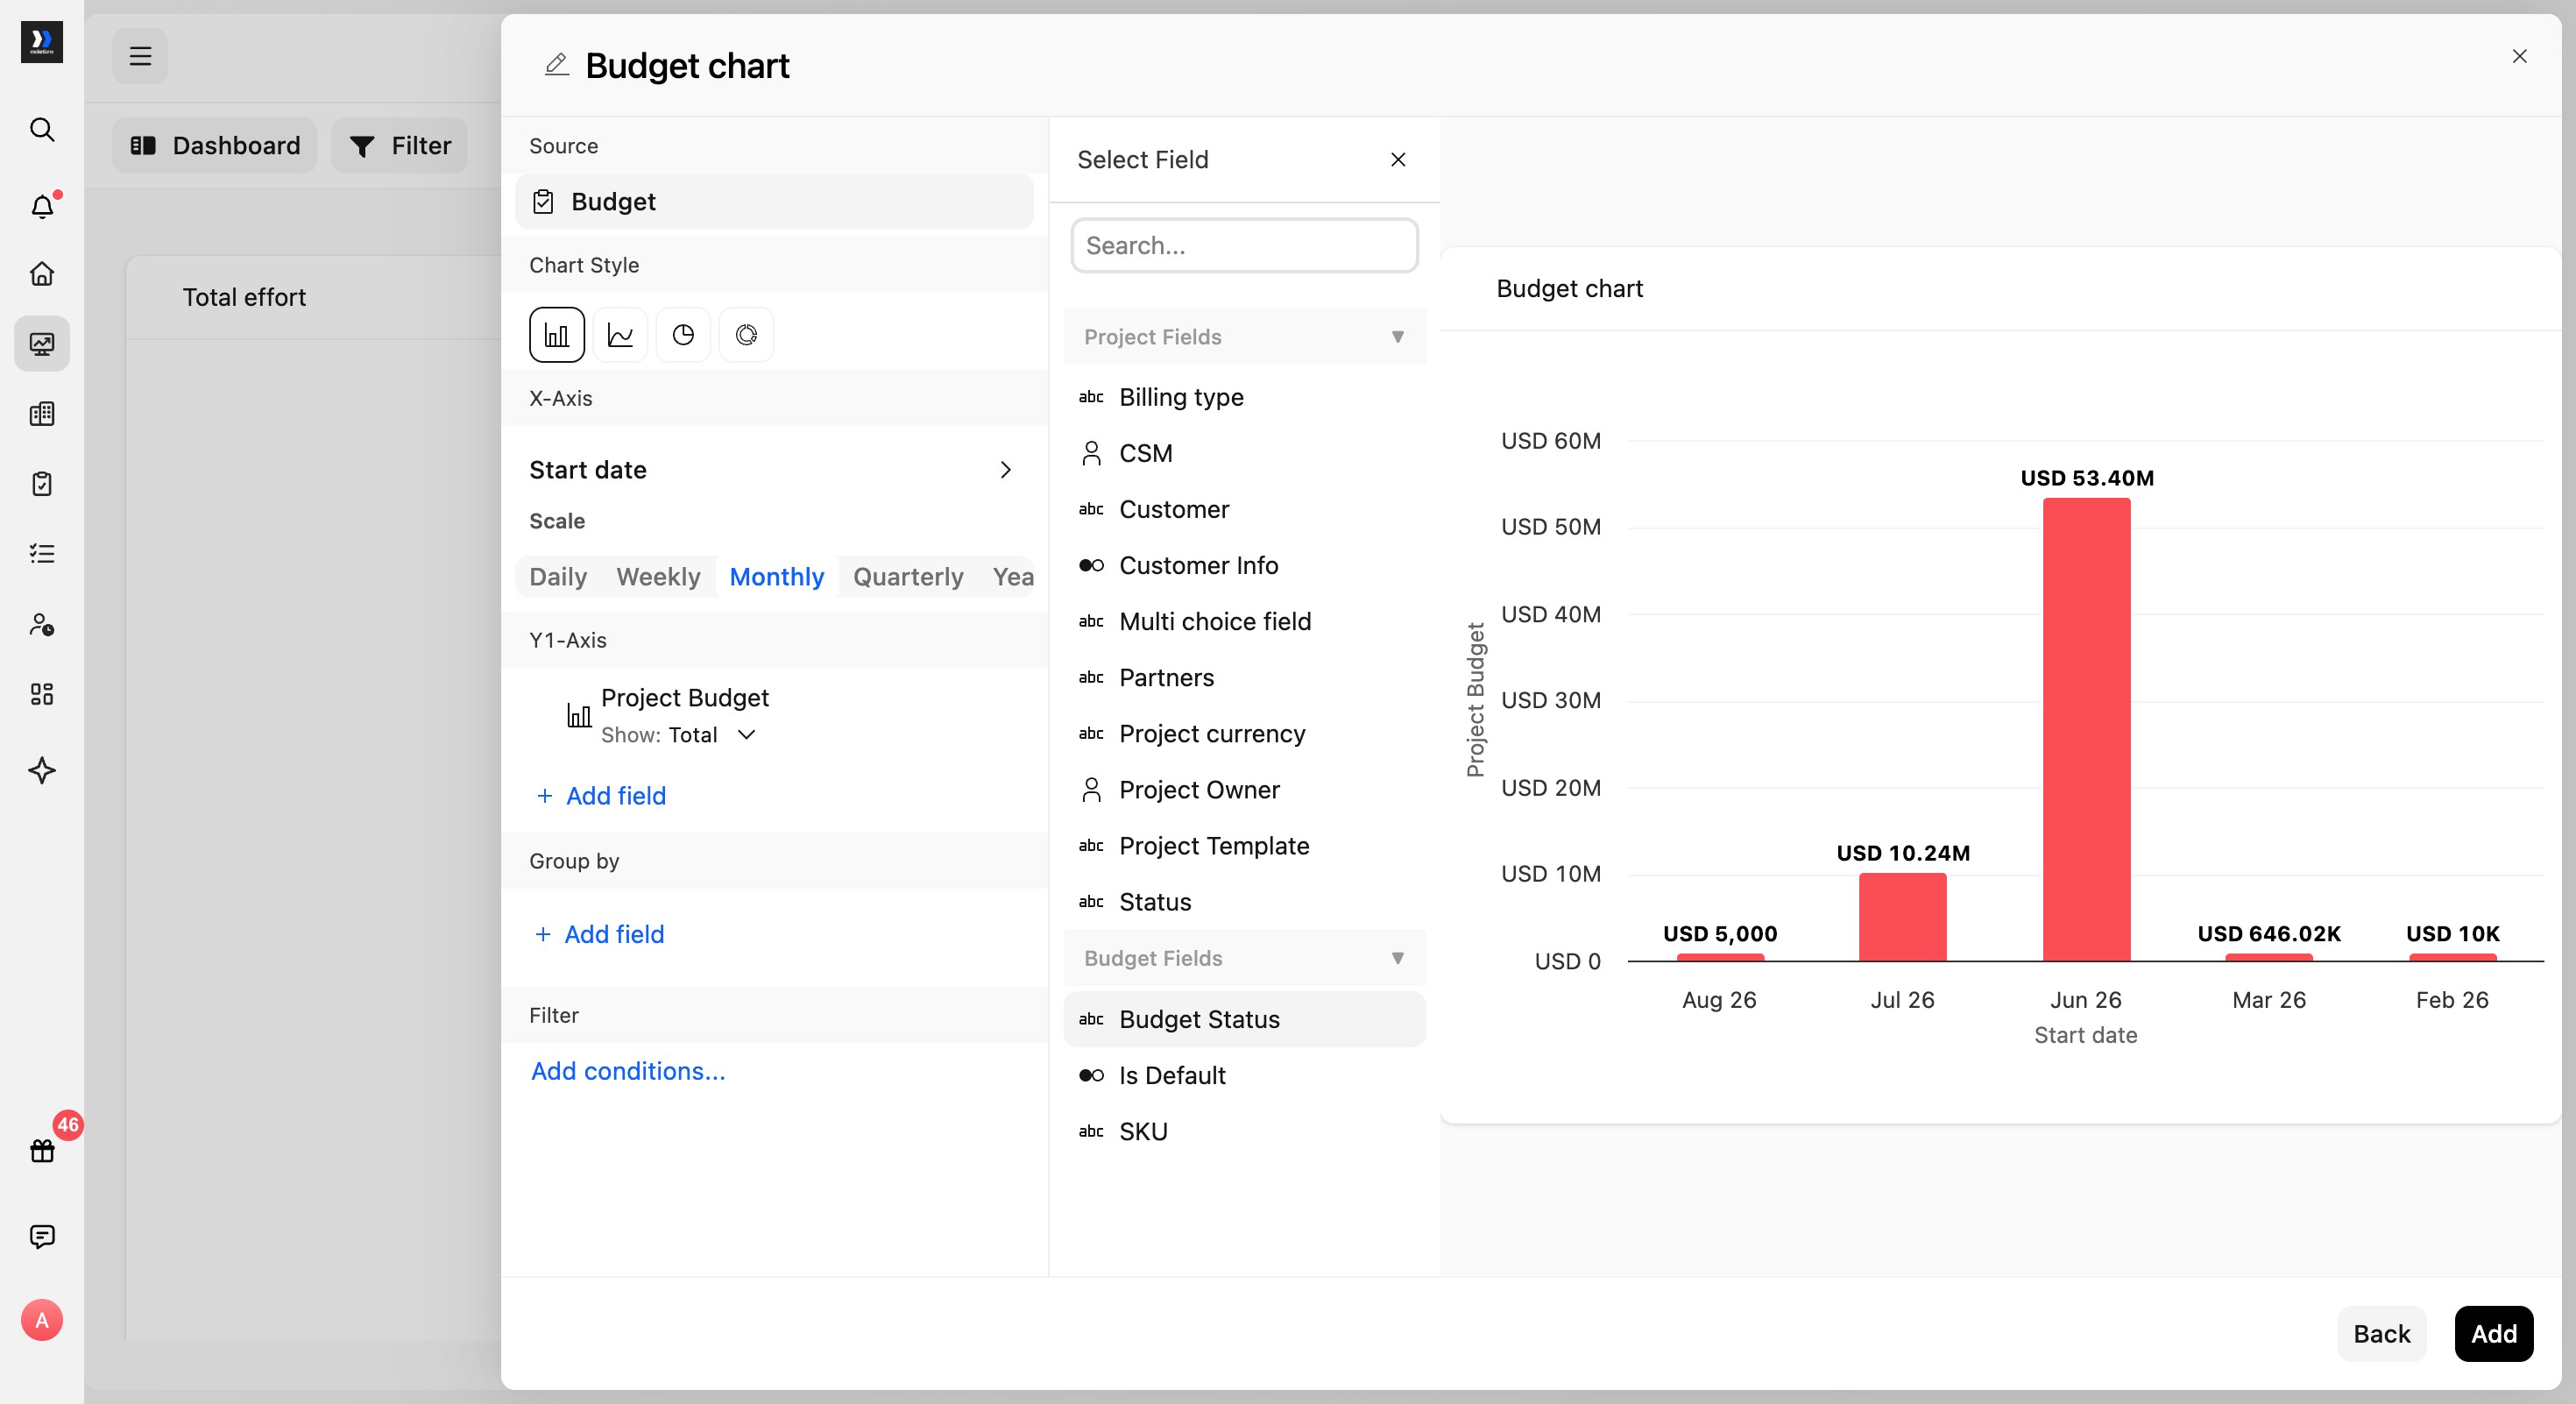
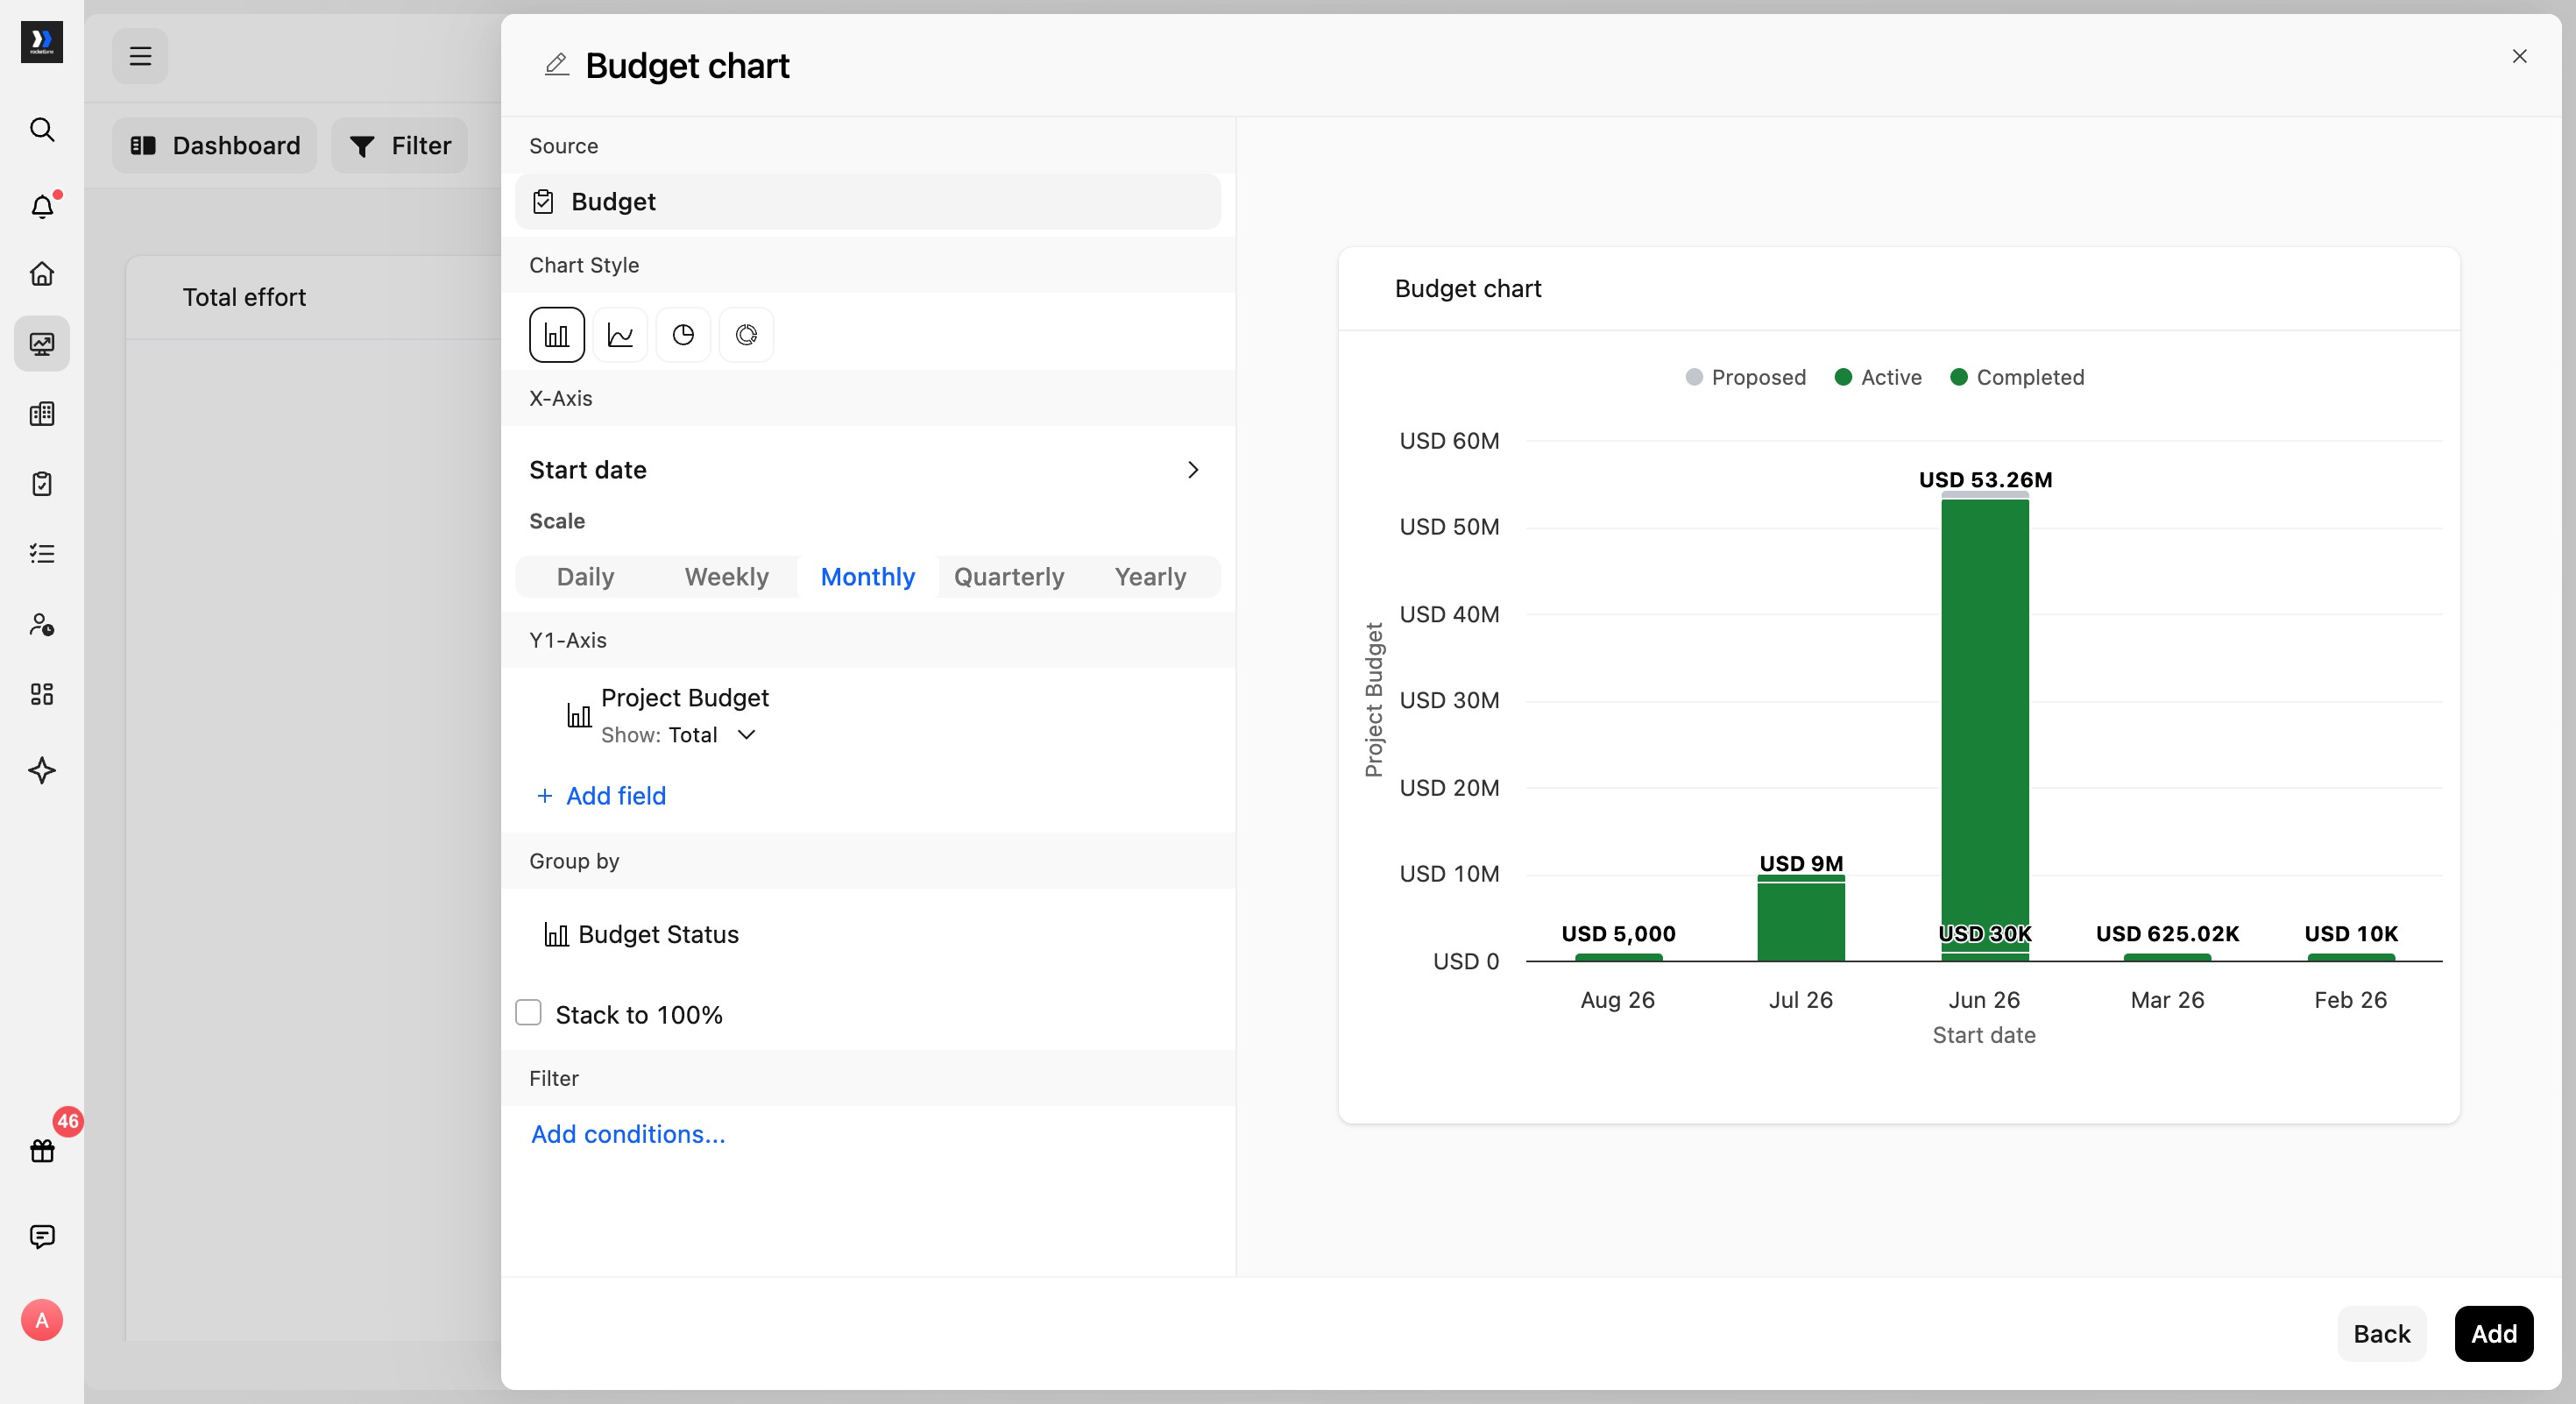
- Under Group by, select Add field, then choose Budget Status.
The chart groups the values into budget statuses such as Proposed, Active, and Completed.
Filter the chart
- Select Add conditions... and choose a budget field such as Budgeted hours.
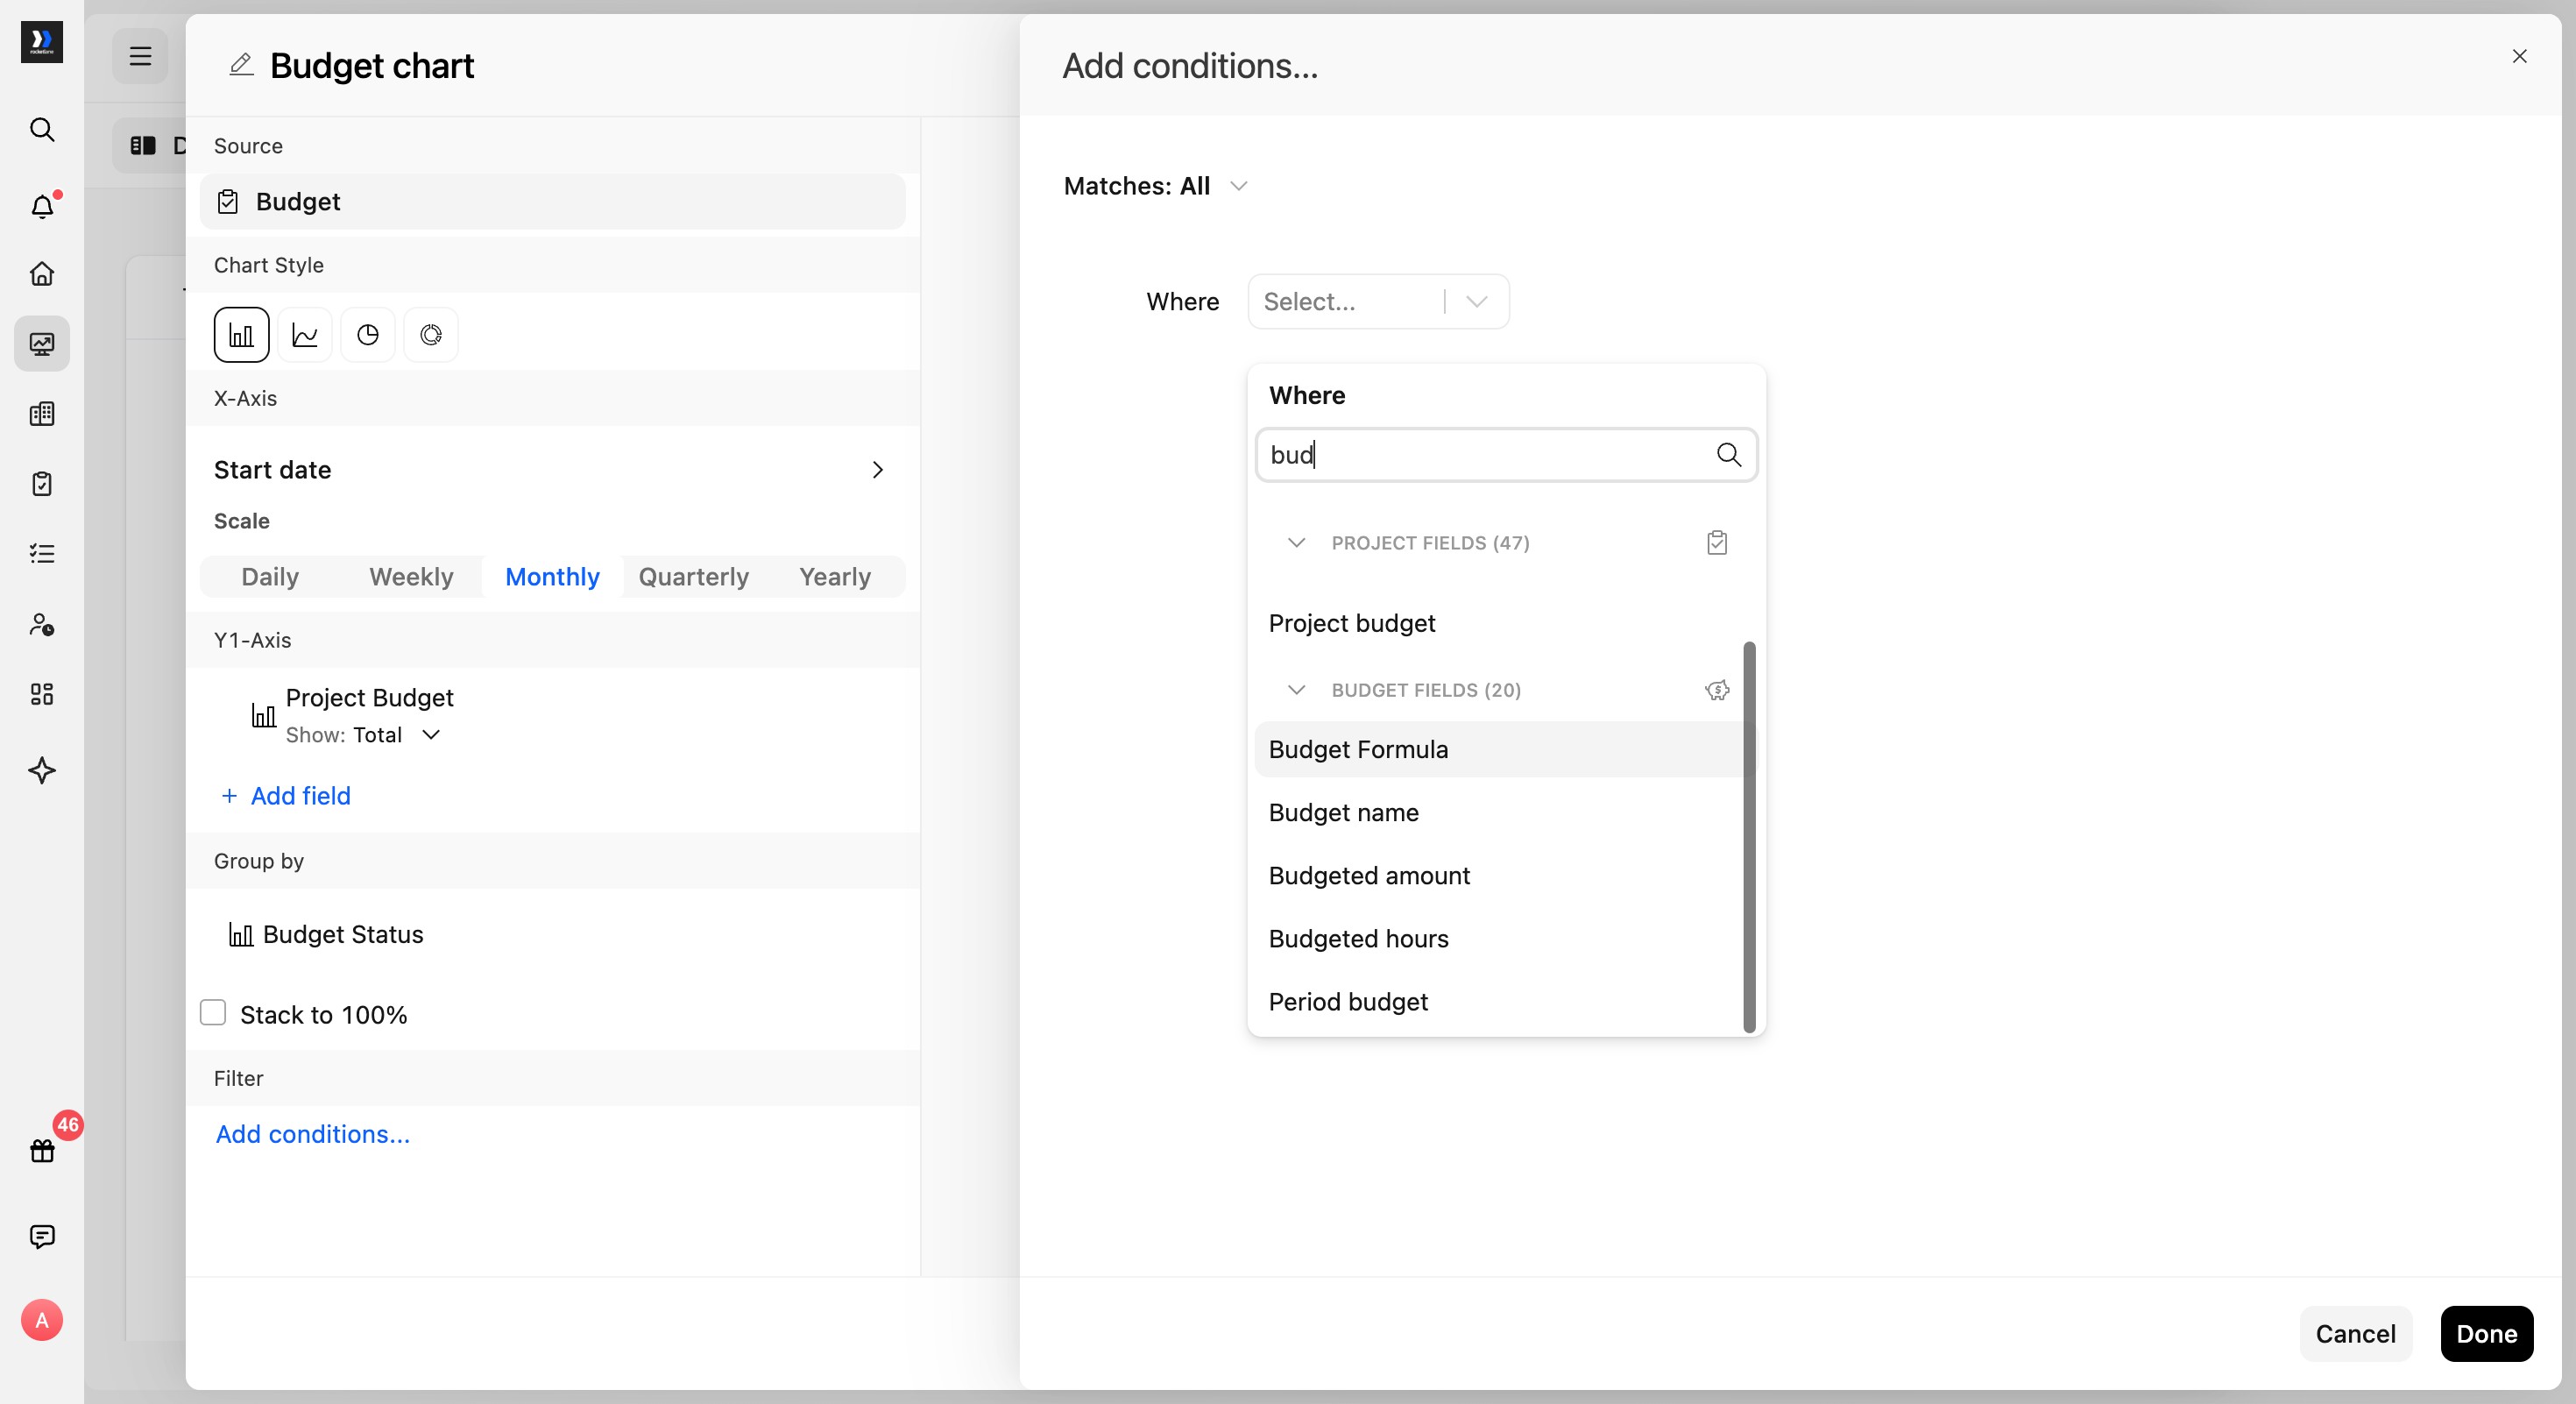
- Select an operator such as is greater than and enter the value you want to use for the condition.
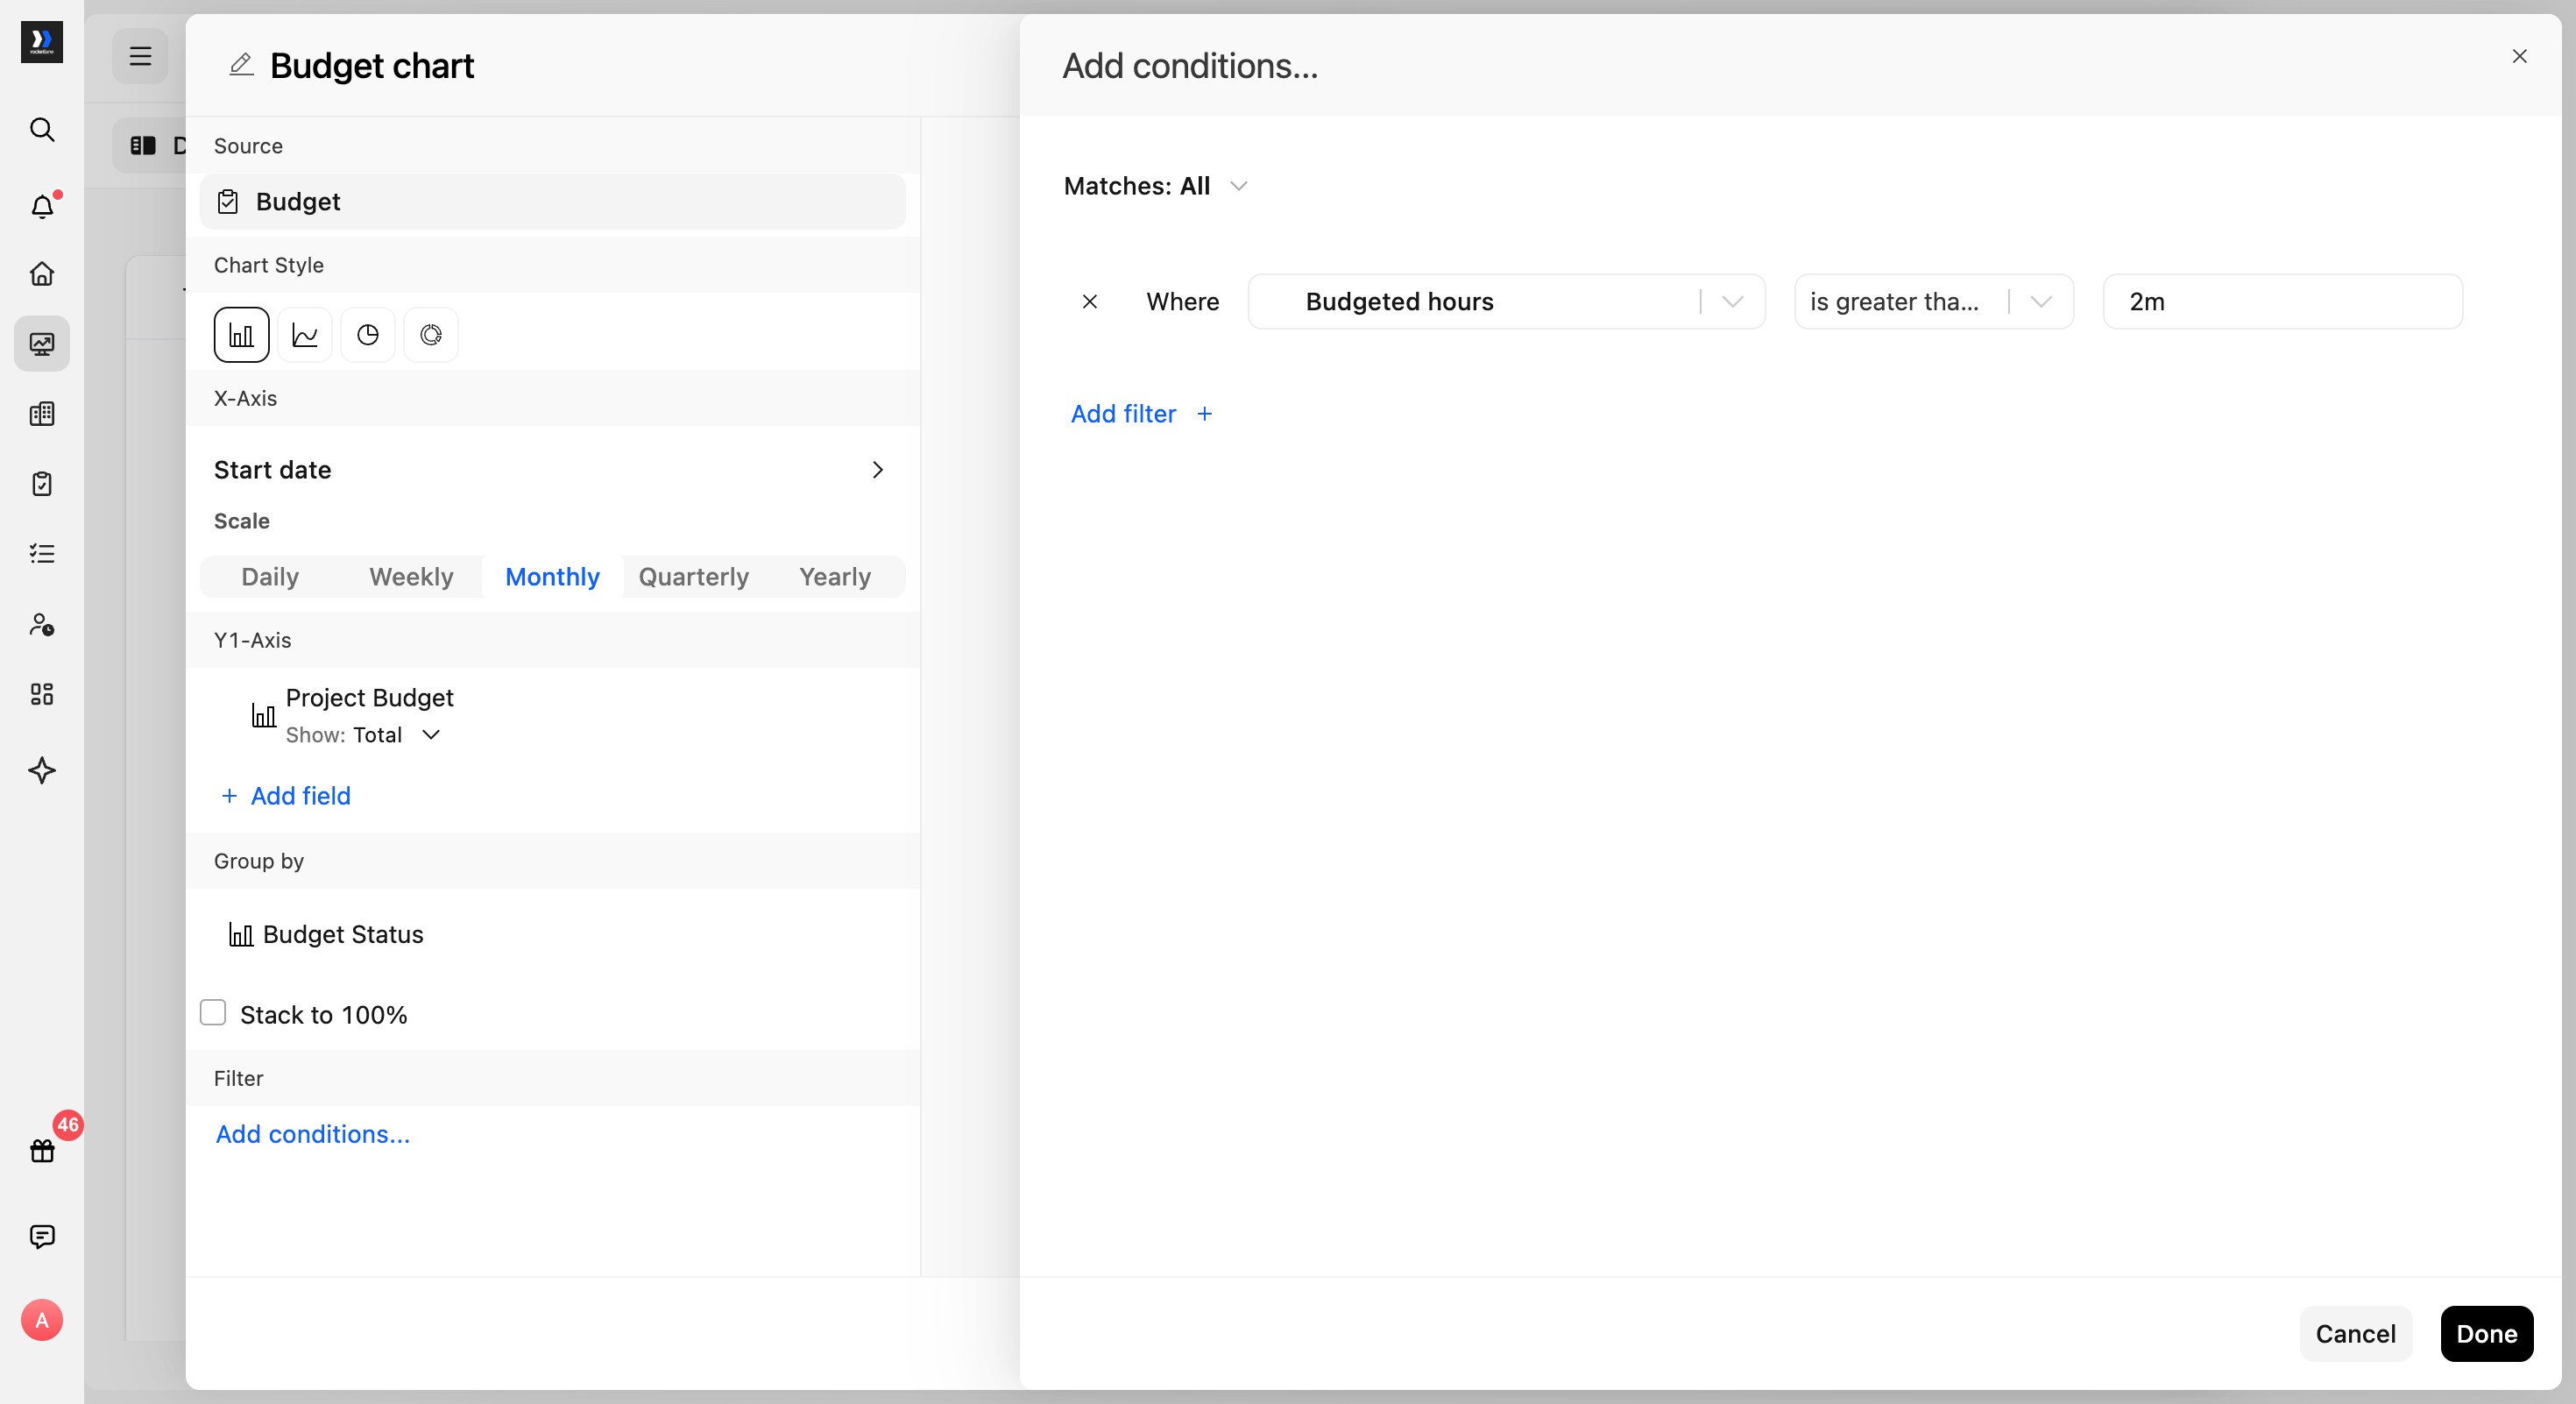
- Select Done to apply the condition.
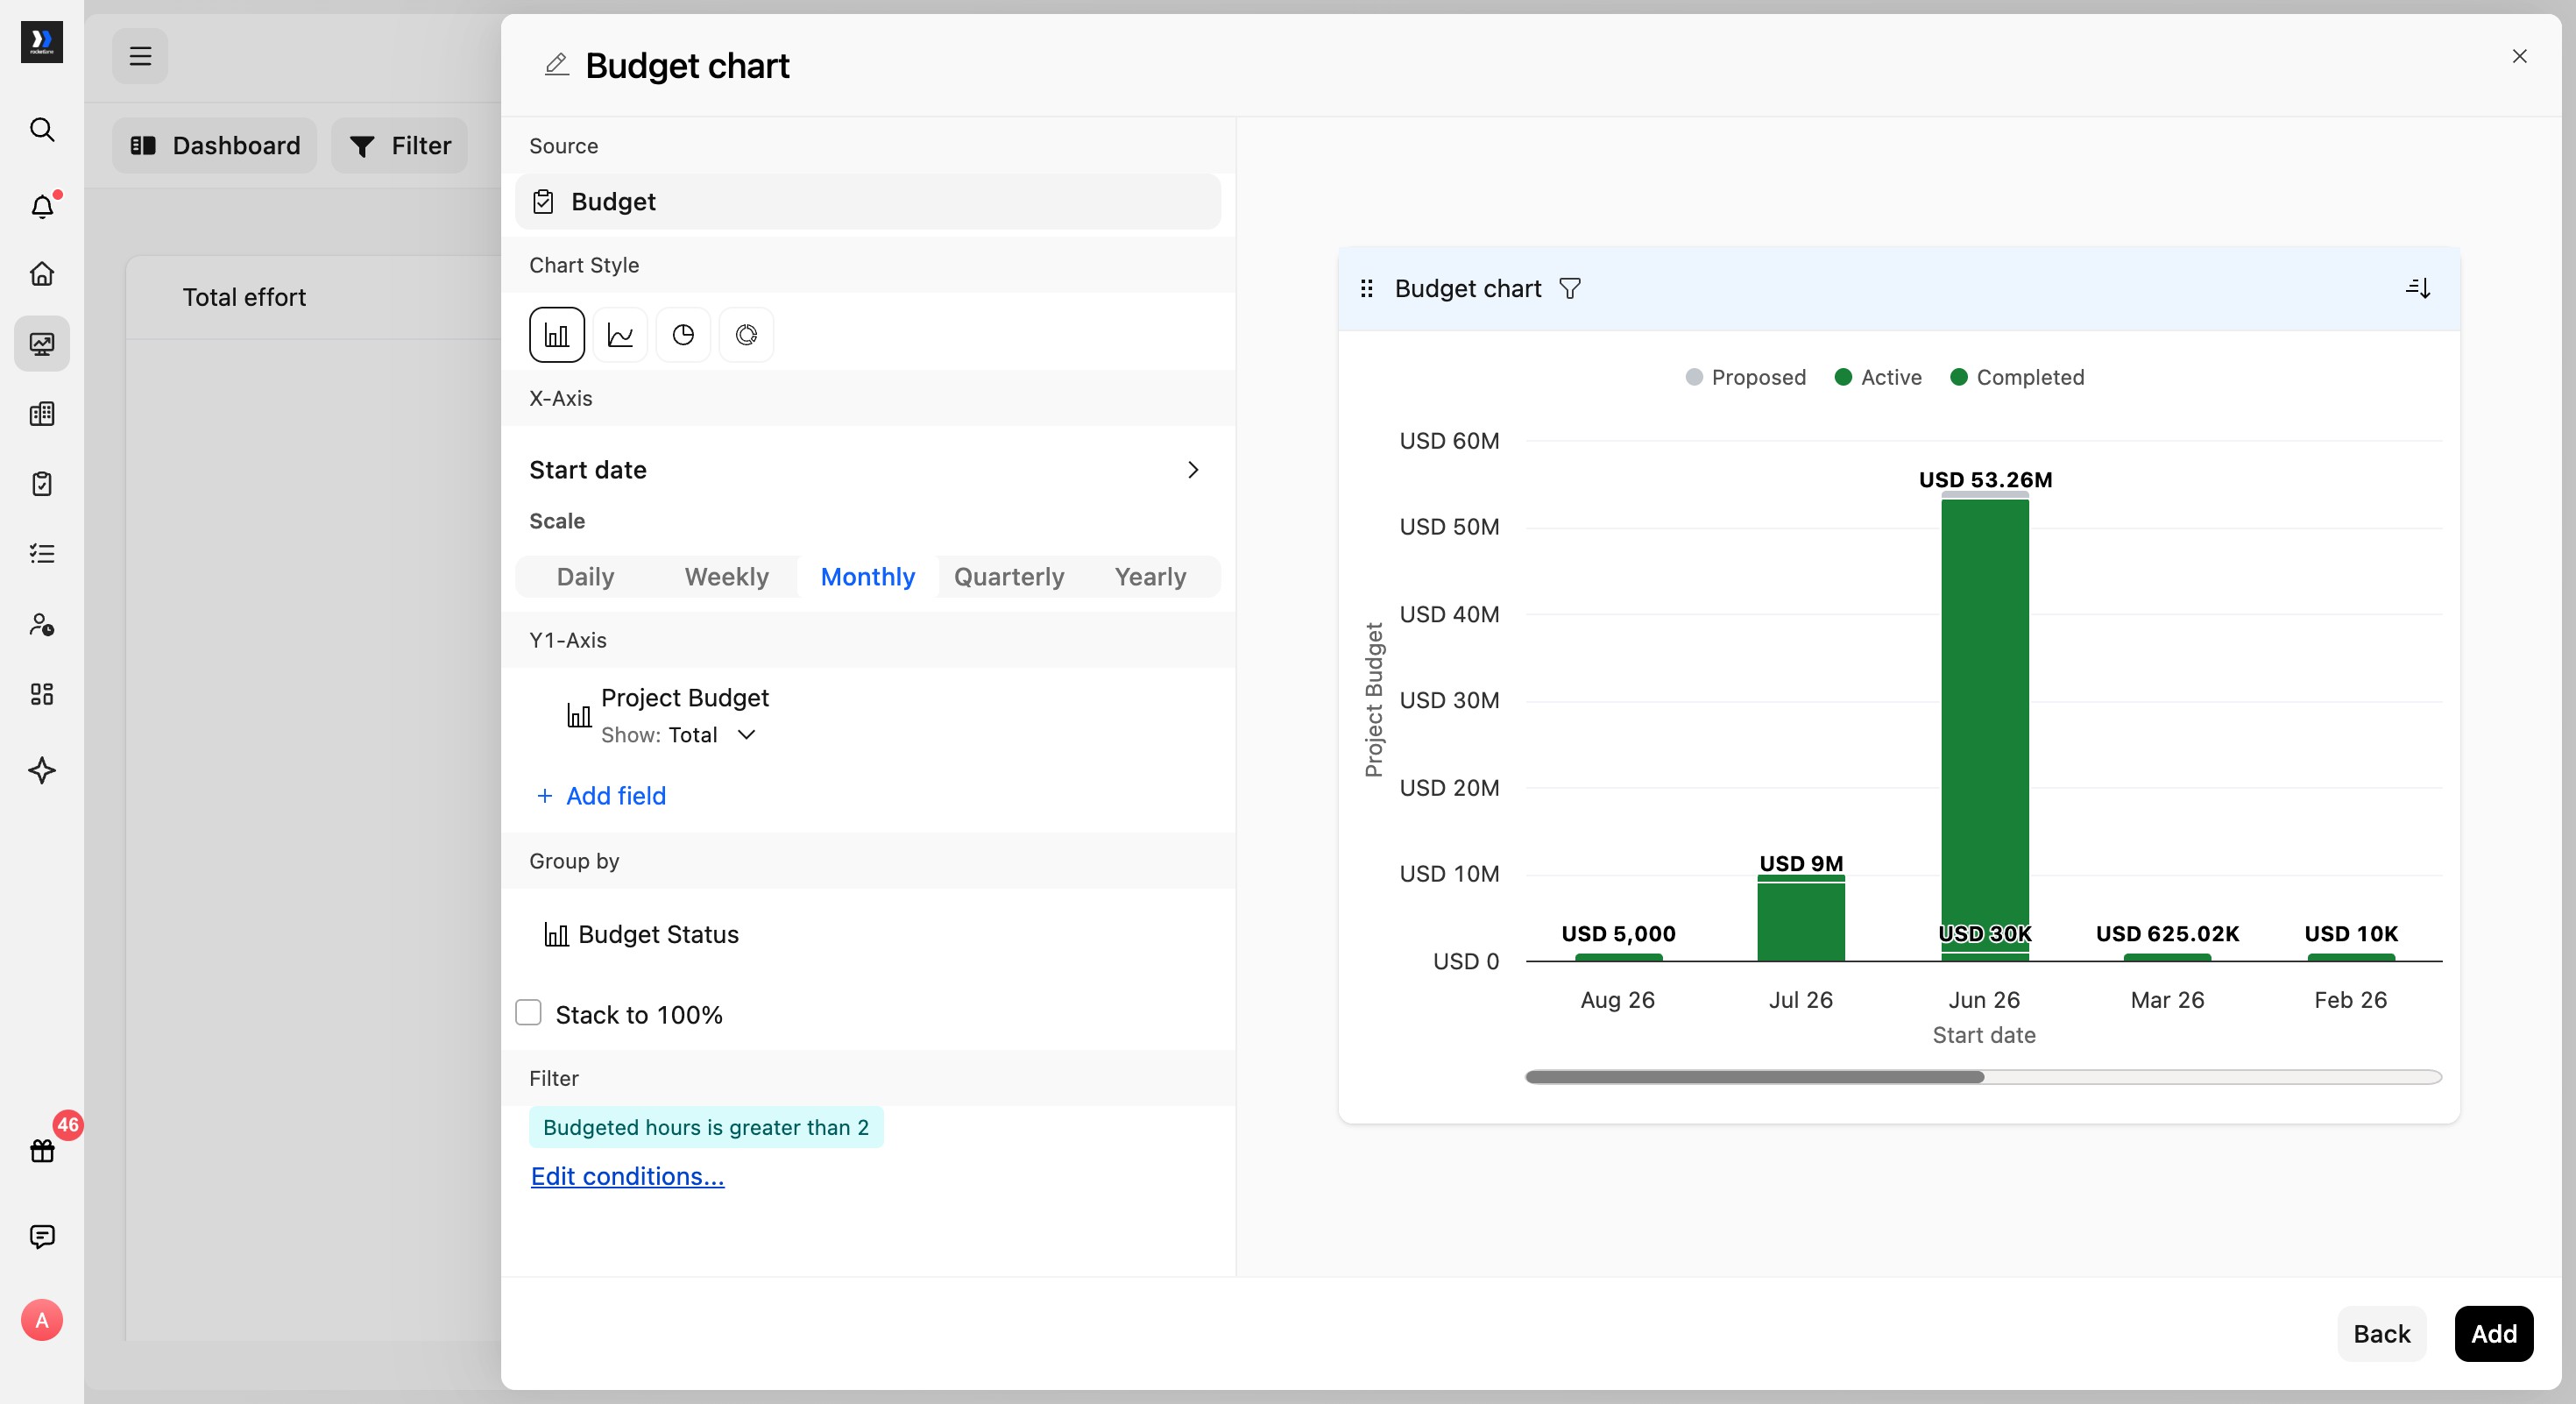
- Select Add to save the chart widget to the dashboard.
Create a custom tabular budget report
- Open Reports from the sidebar.
- Open the Custom Reports tab and select New custom report.
- Choose Tabular, then select Next.
- Select Budget as the report source.
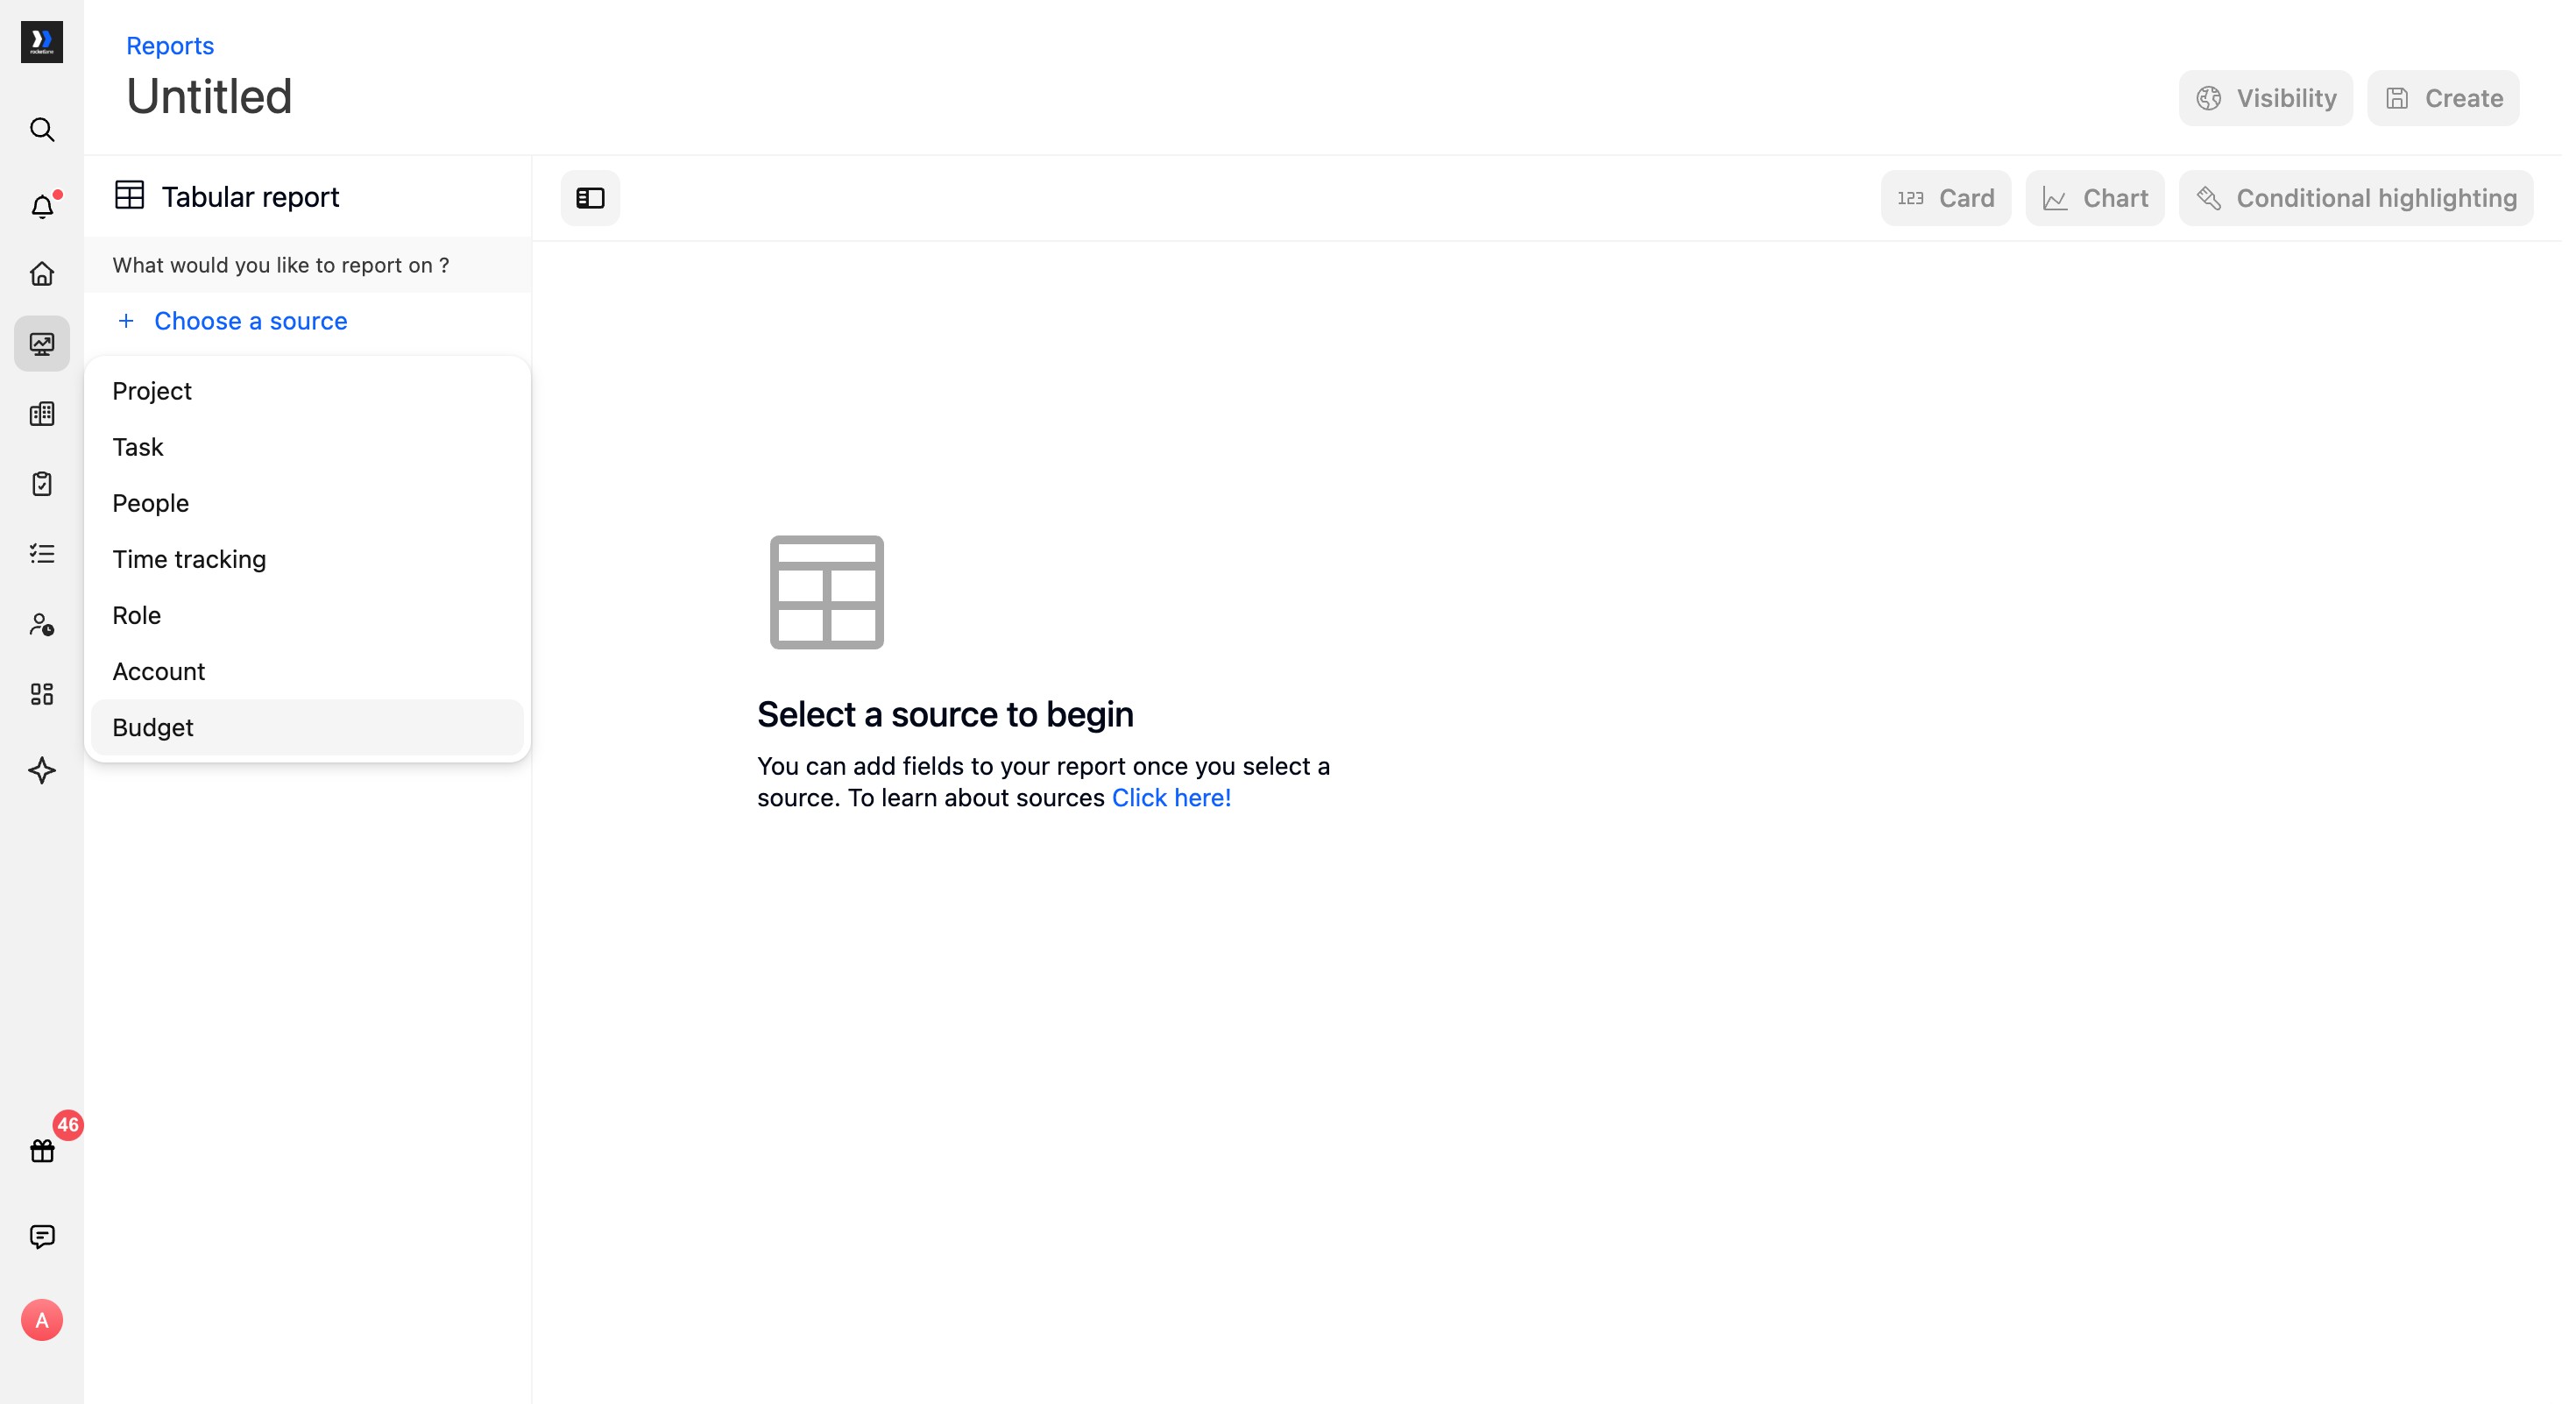
- Enter a name for the report. Under Columns, select Add fields....
- Expand Budget Fields and select Budget Start Date.
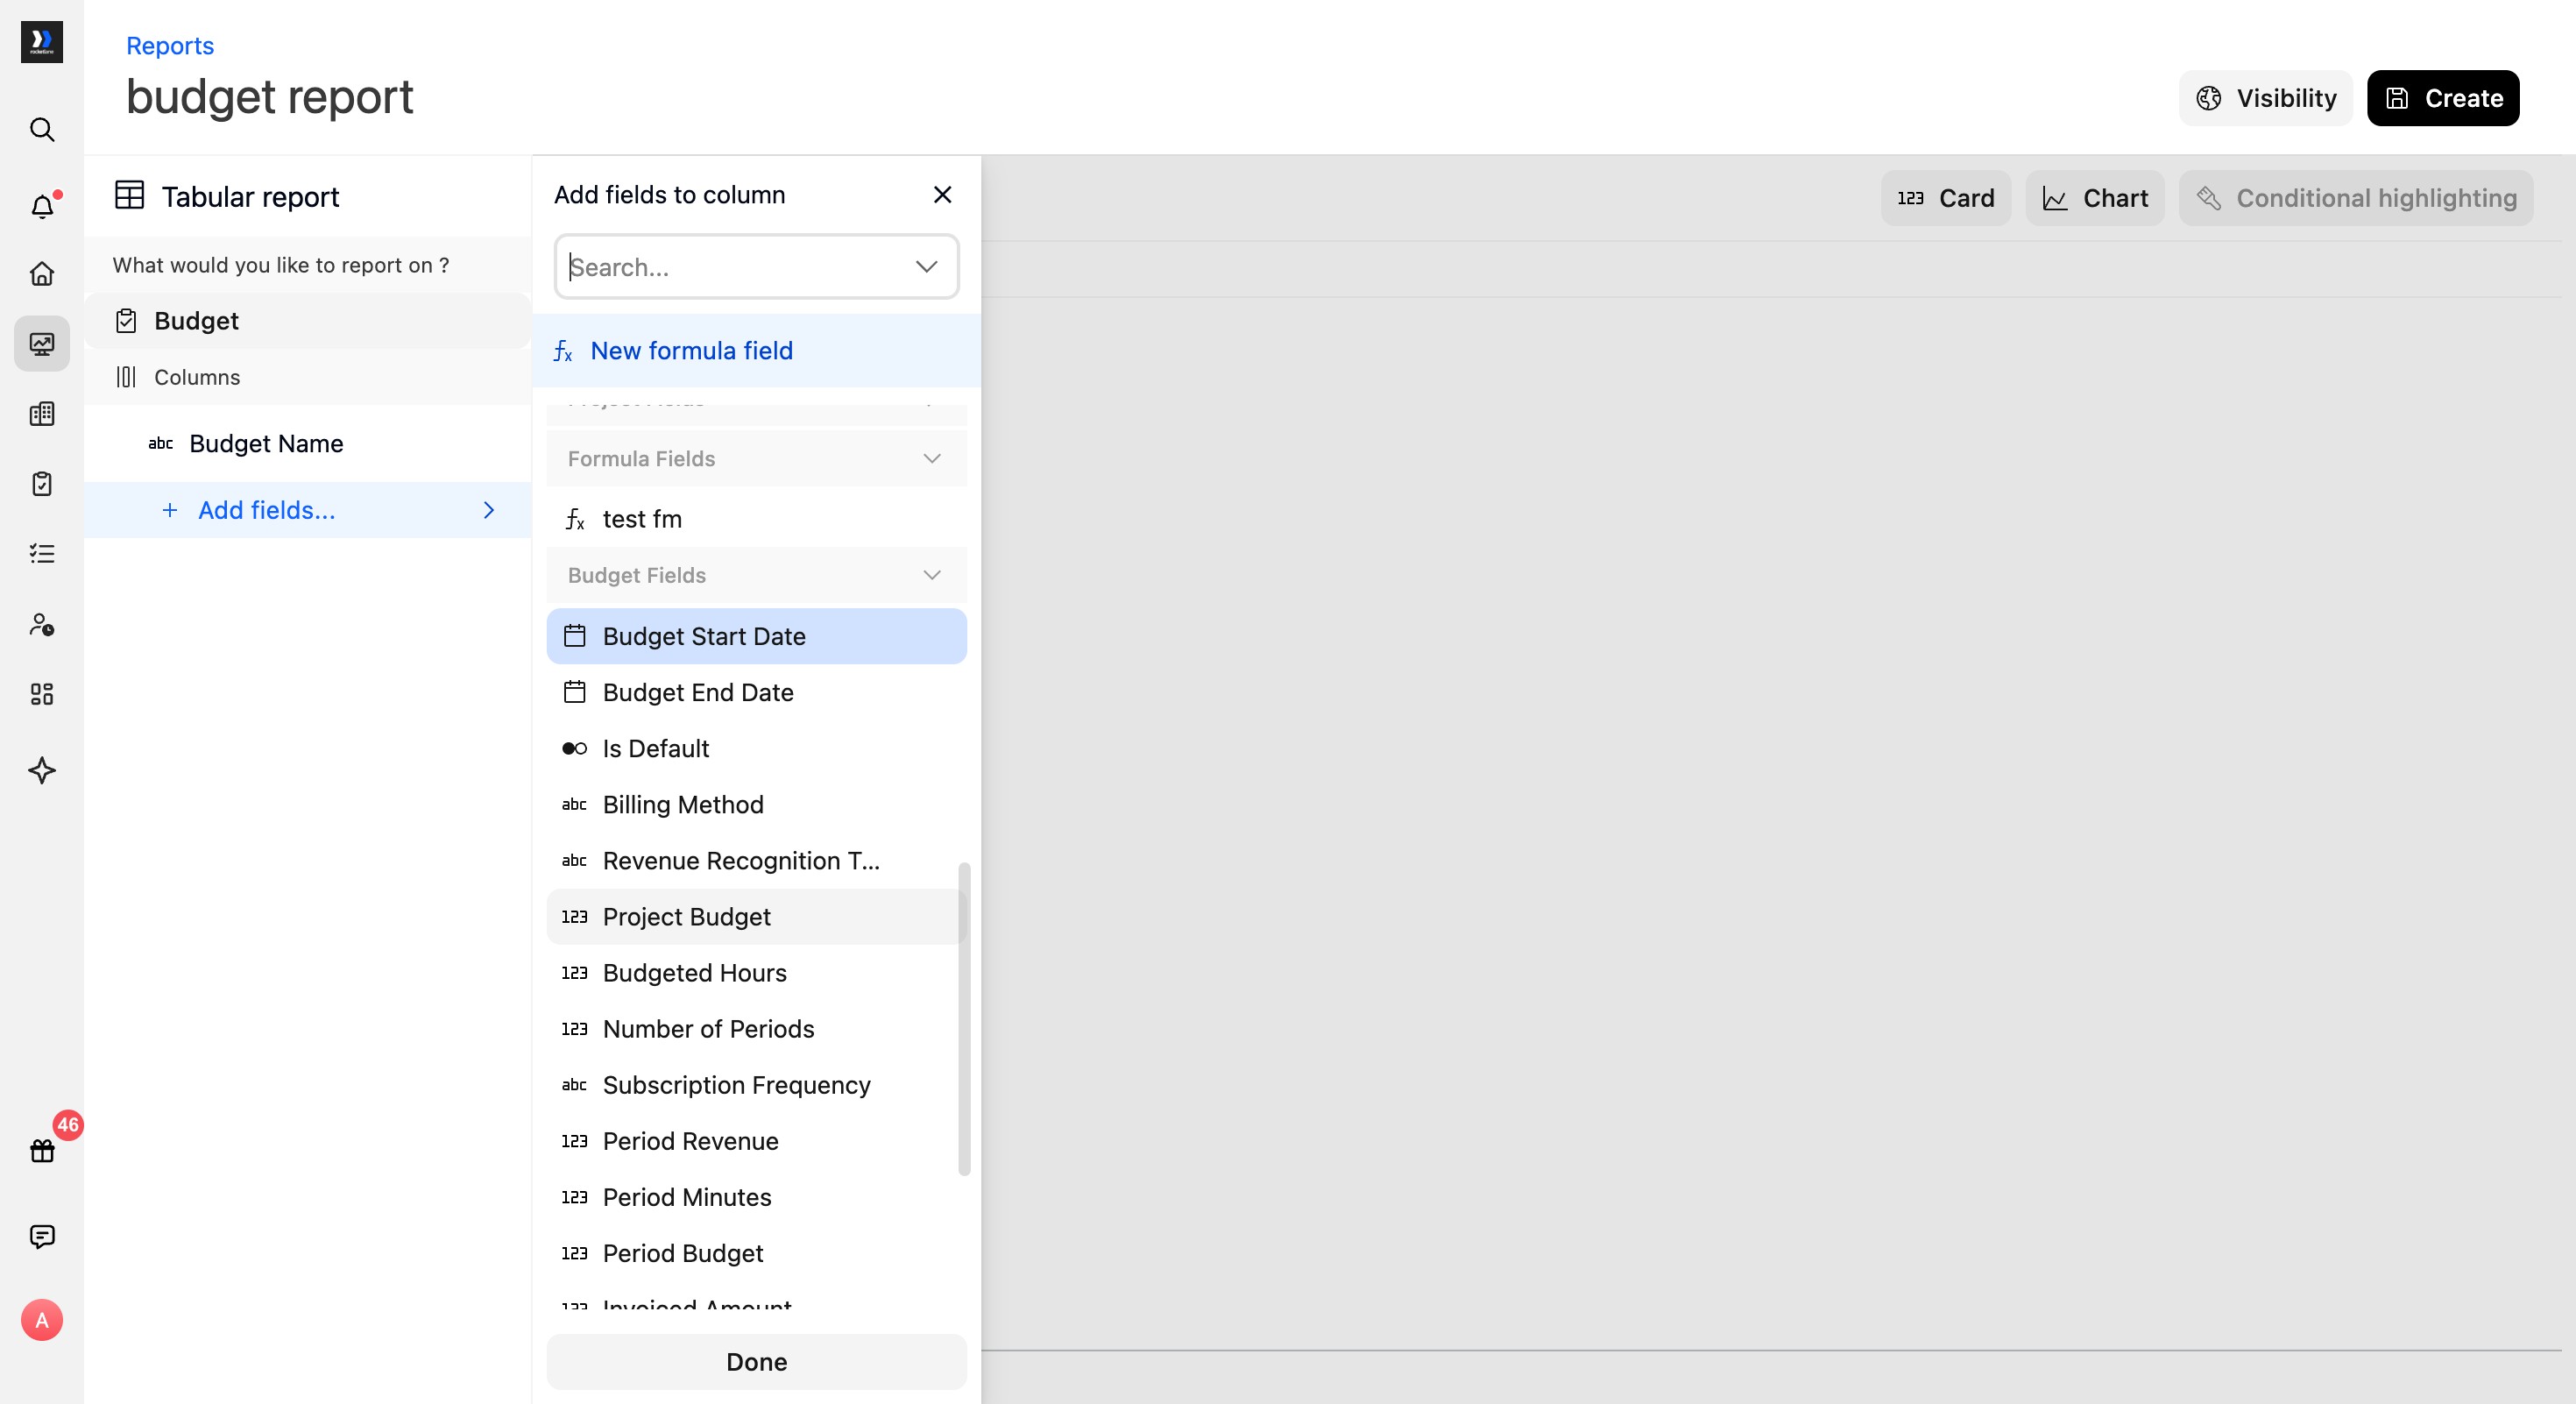
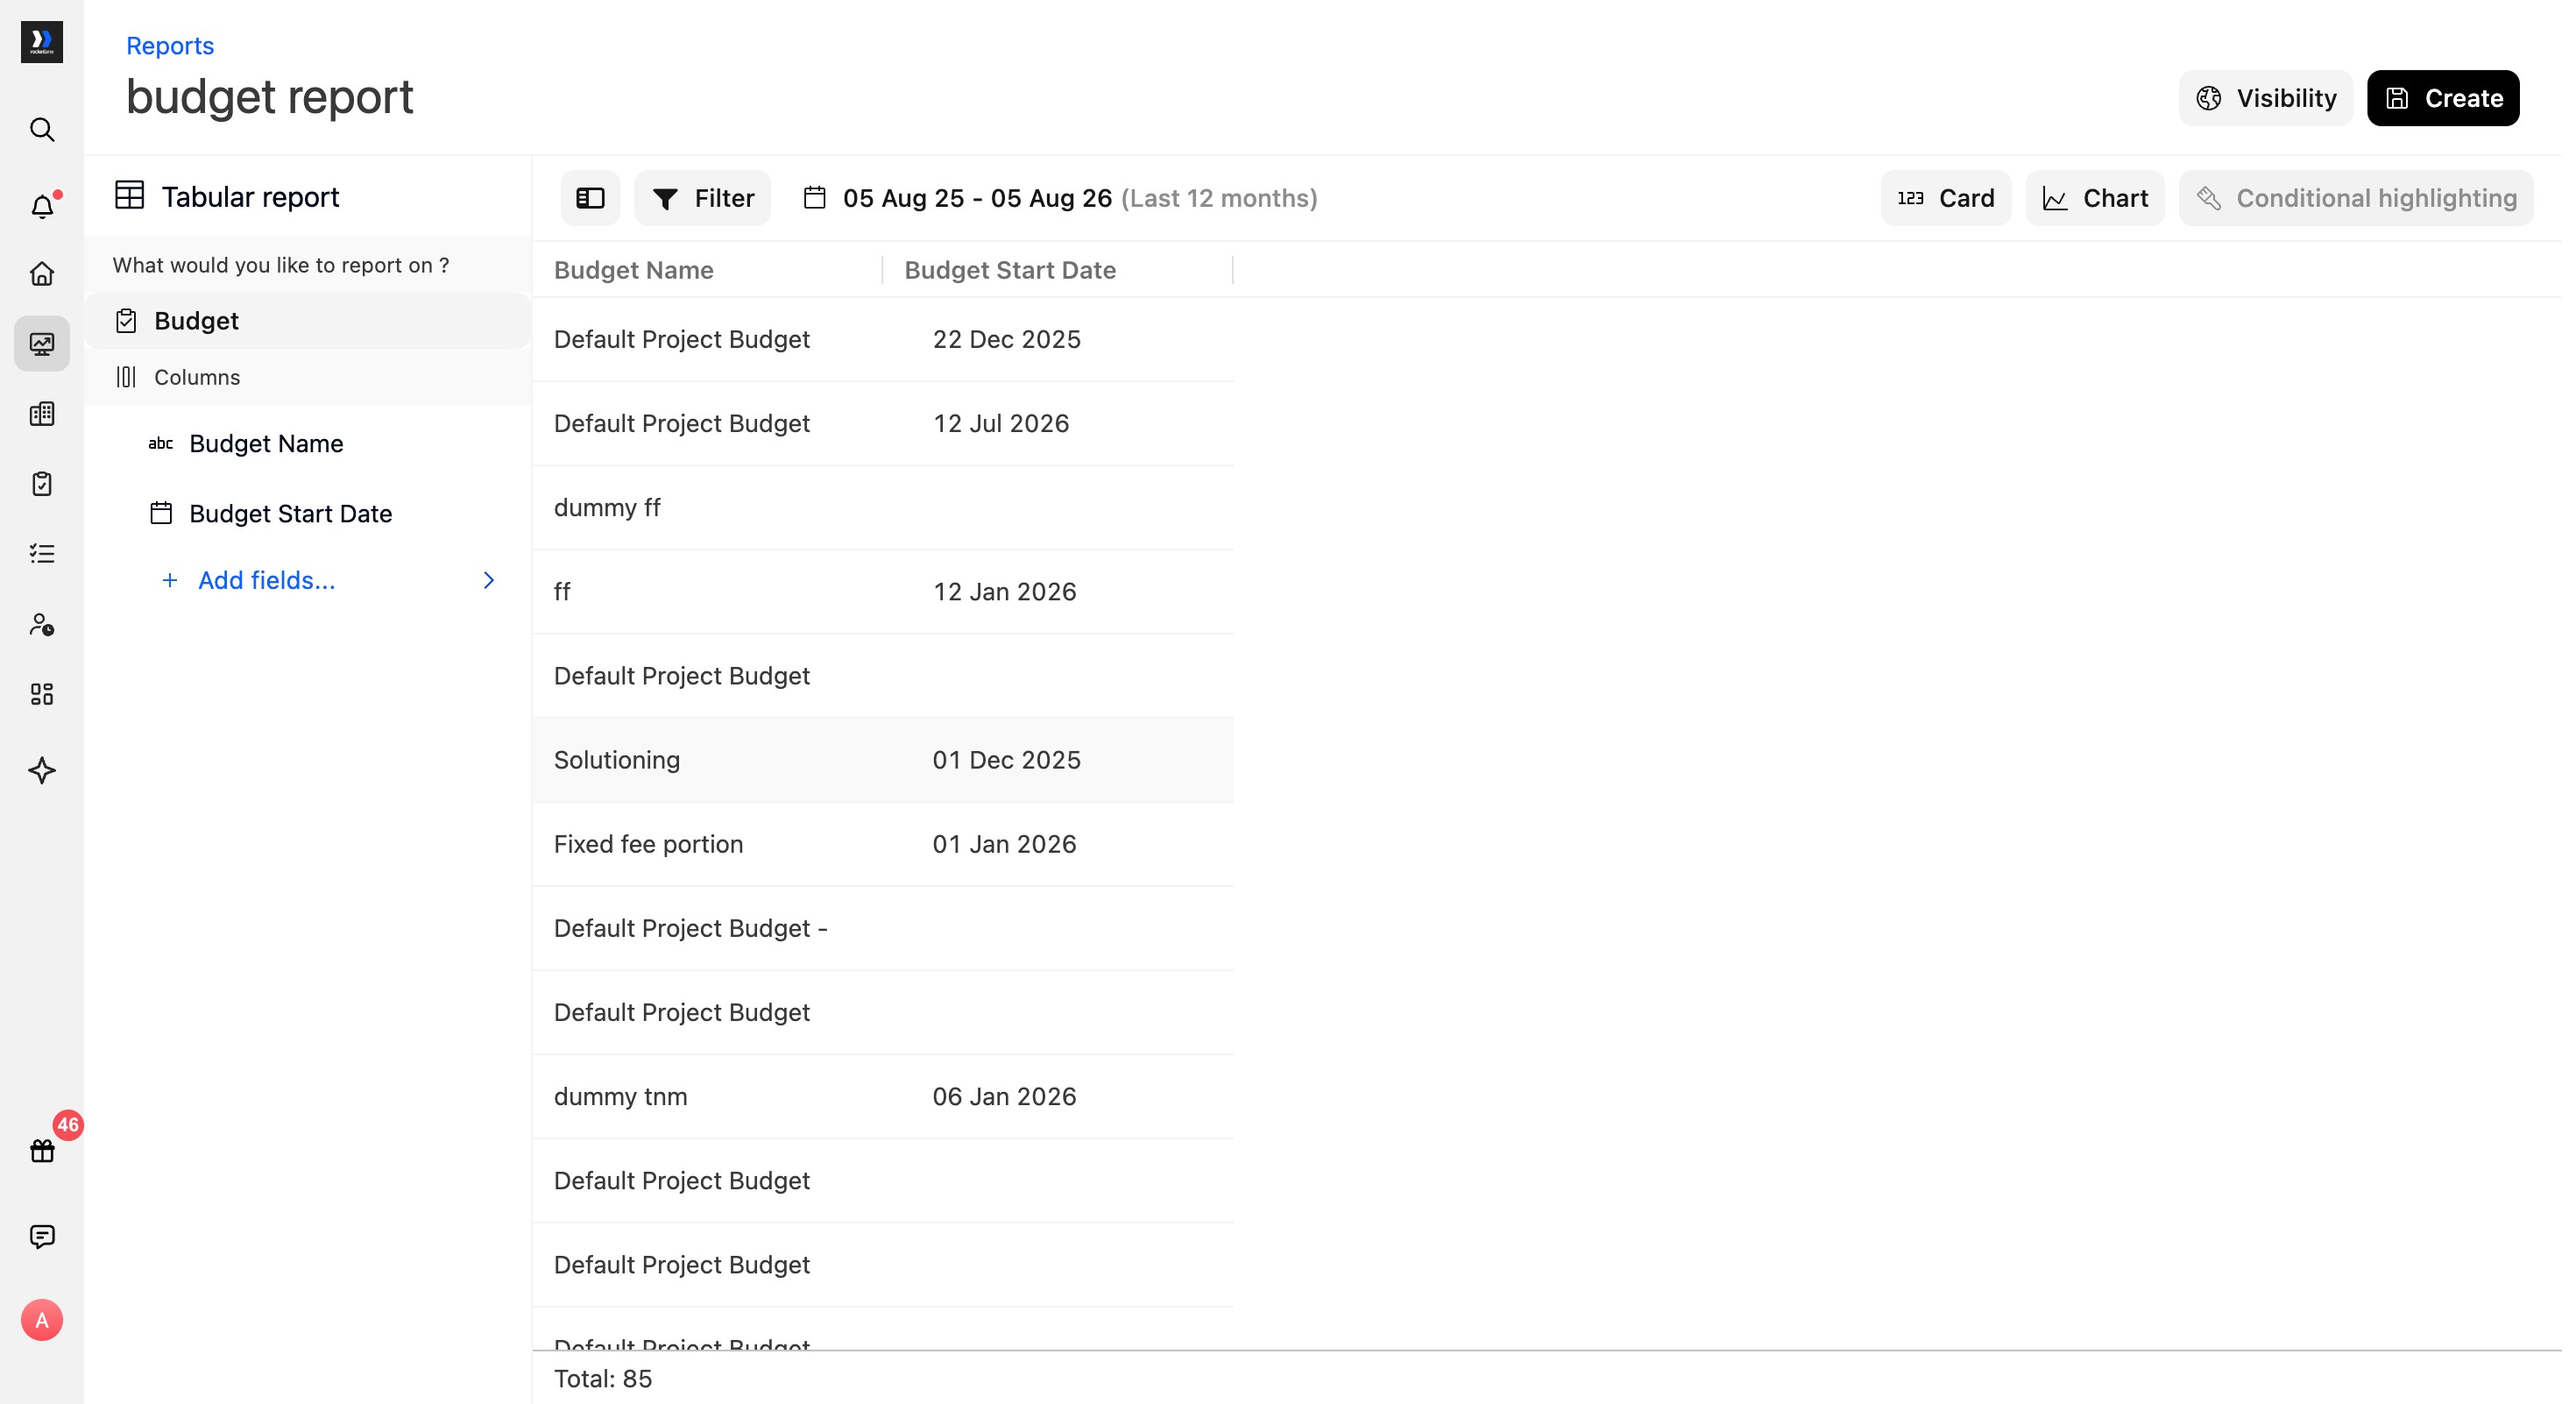
- Select Done. The report displays Budget Name and Budget Start Date.
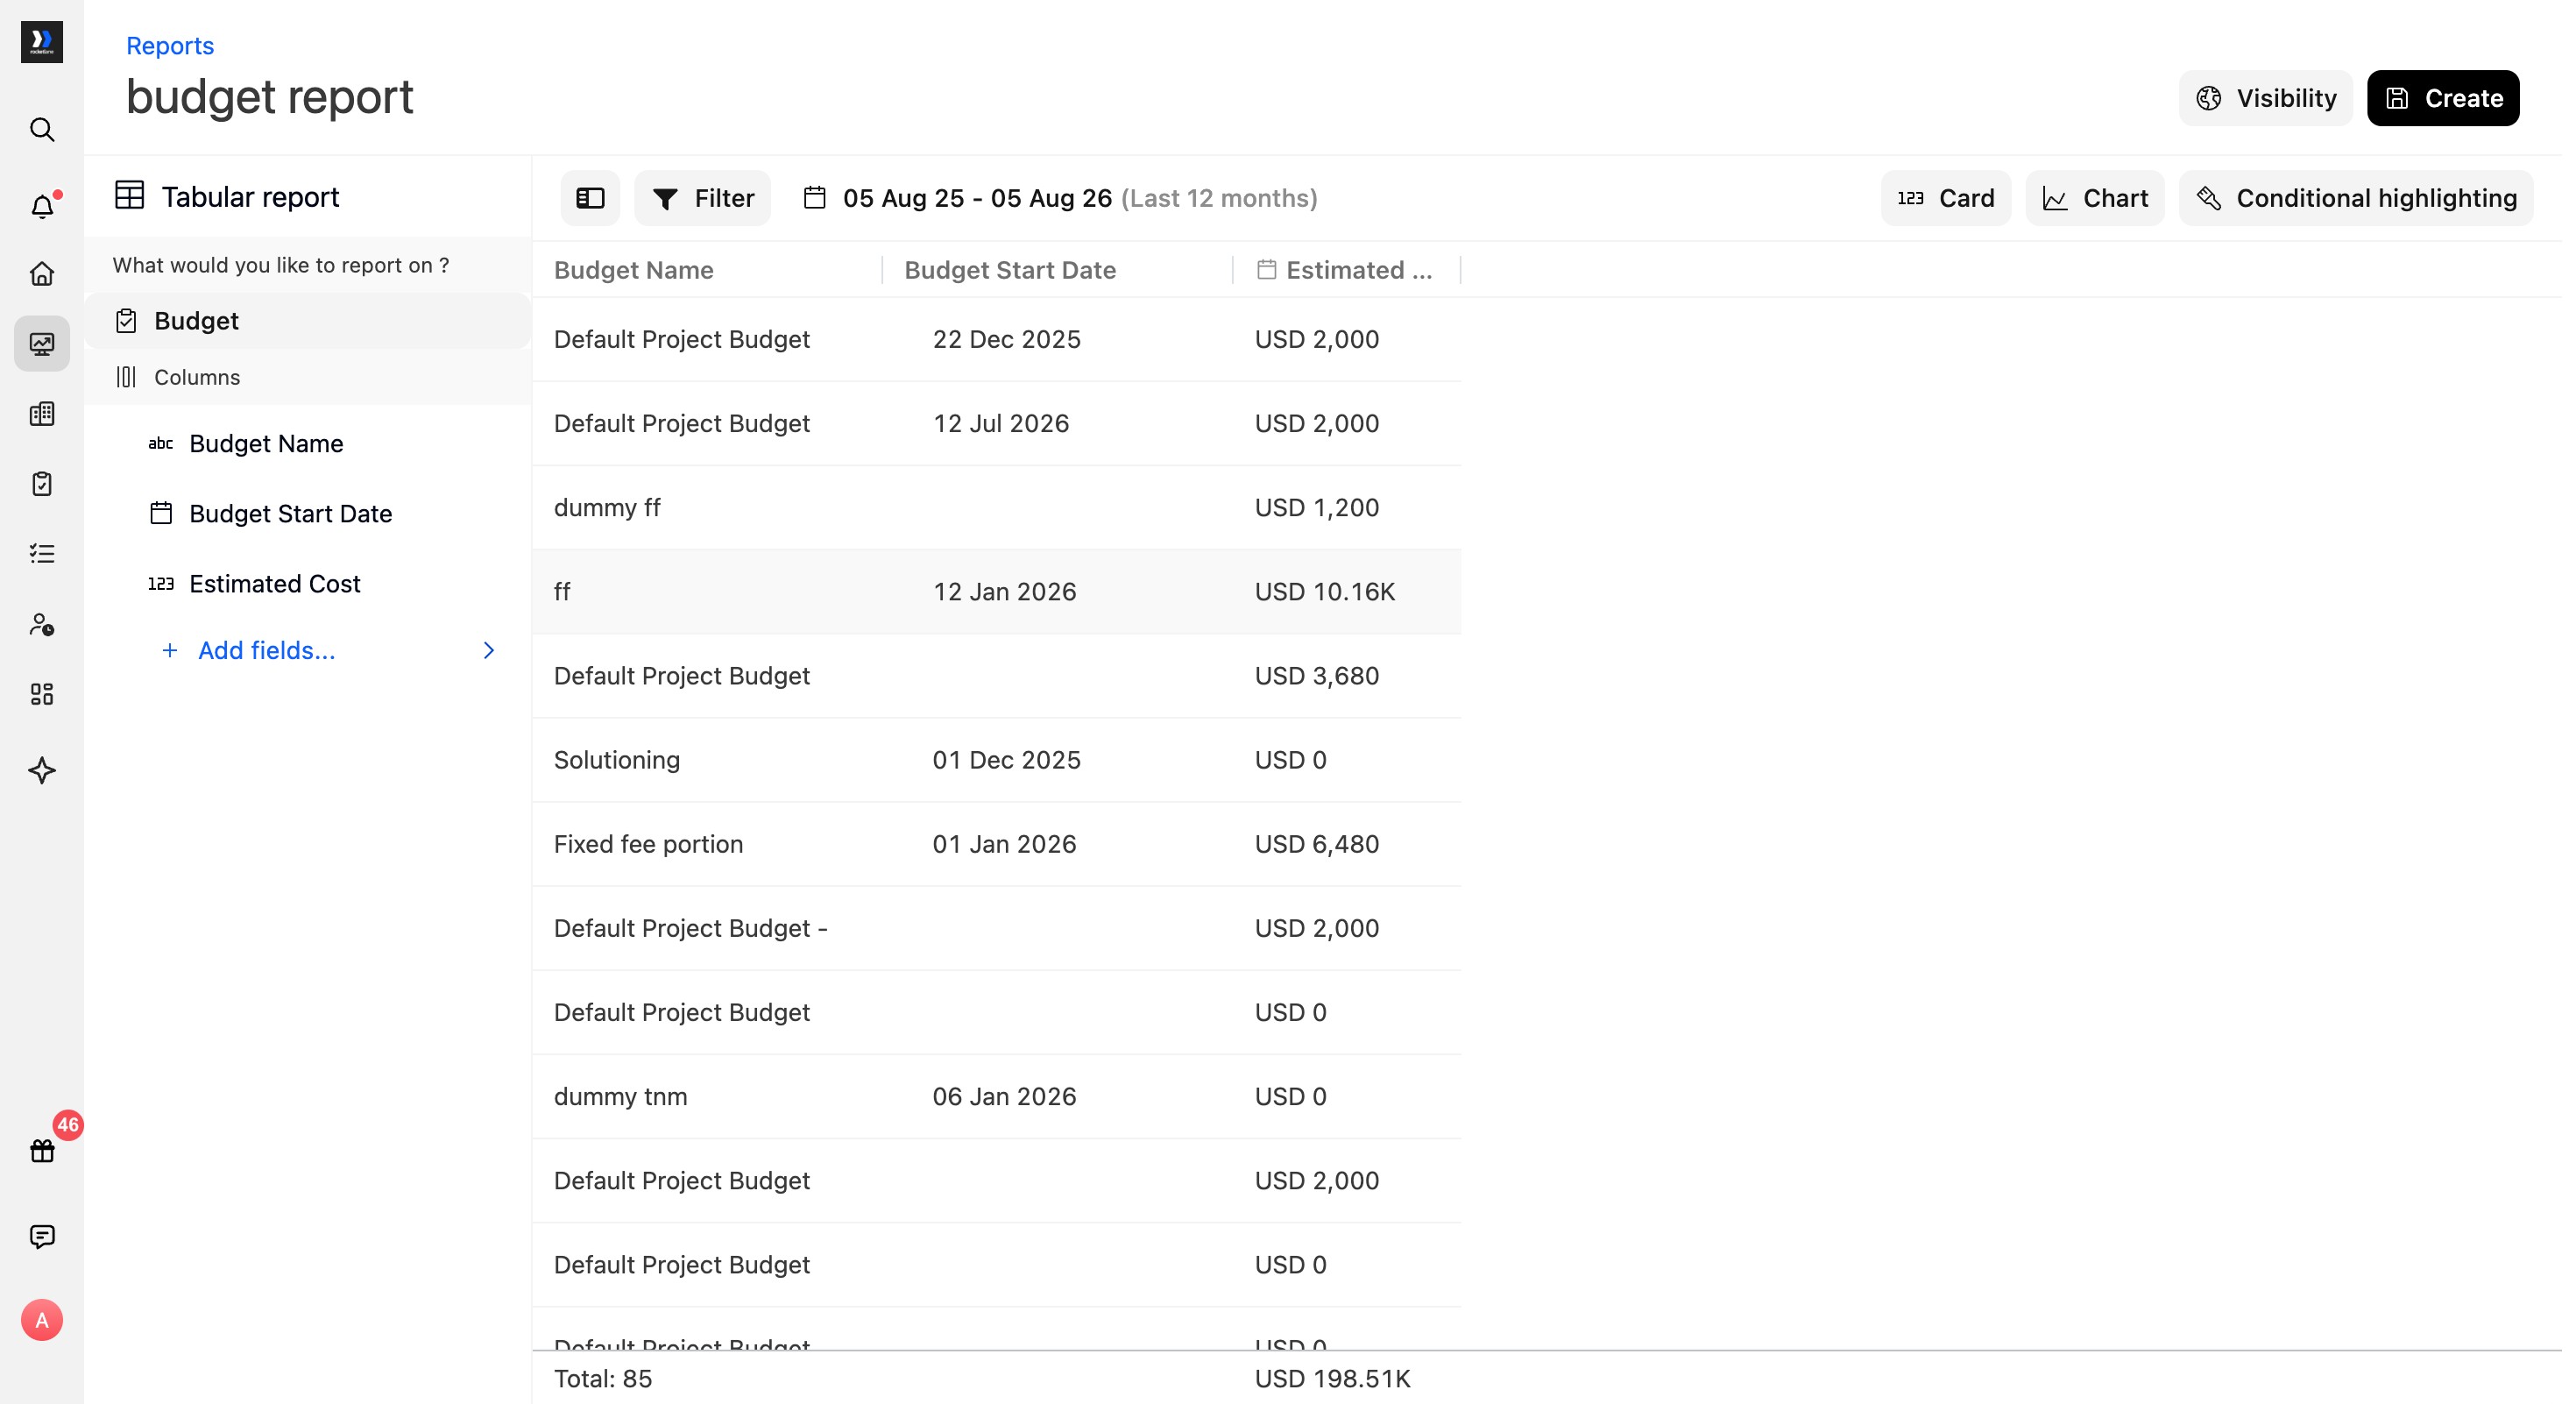
- To include a financial metric, select Add fields..., choose Estimated Cost under Financials Fields, and select Done.
Create a custom pivot budget report
Pivot reports can use either Project or Budget as their source, depending on whether you want project-level or budget-level analysis.
Using Project as the source
- From the Reports page, select New custom report.
- Choose Pivot table, then select Next.
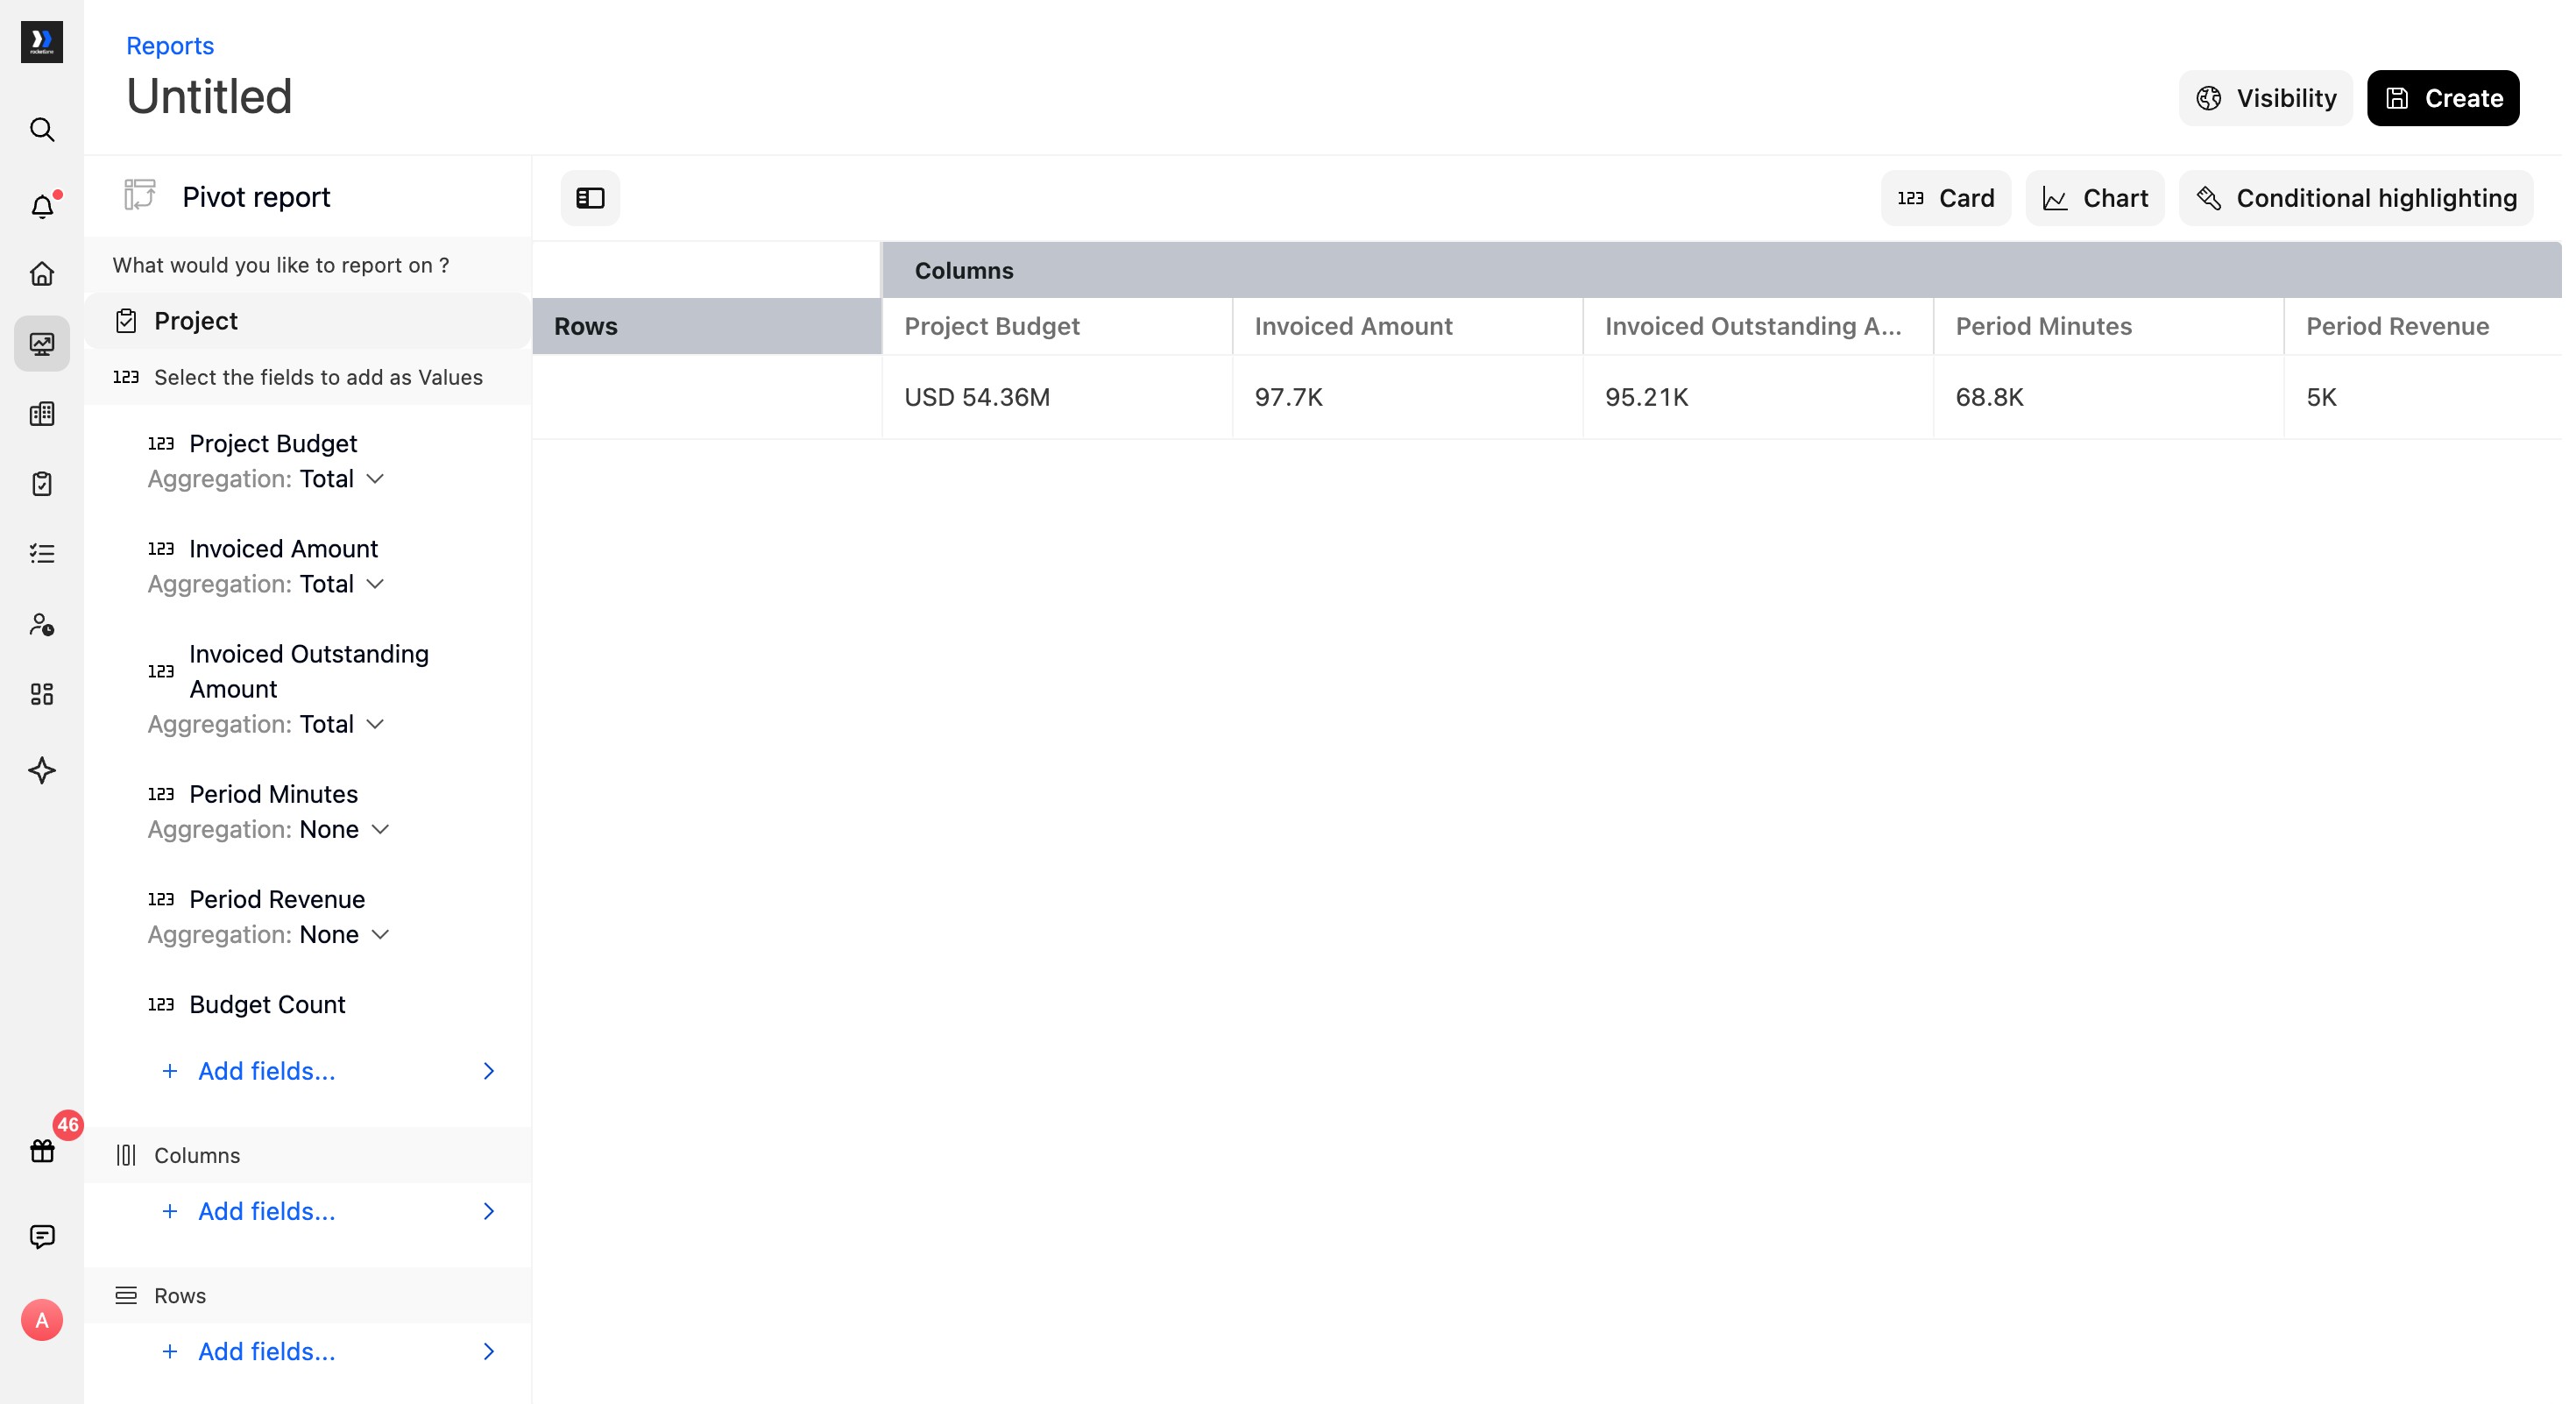
- Select Project as the source.
- Under Values, select Add fields....
- Add the project and financial fields you want to summarize, such as Project Budget, Invoiced Amount, Invoiced Outstanding Amount, Period Minutes, Period Revenue, and Budget Count.
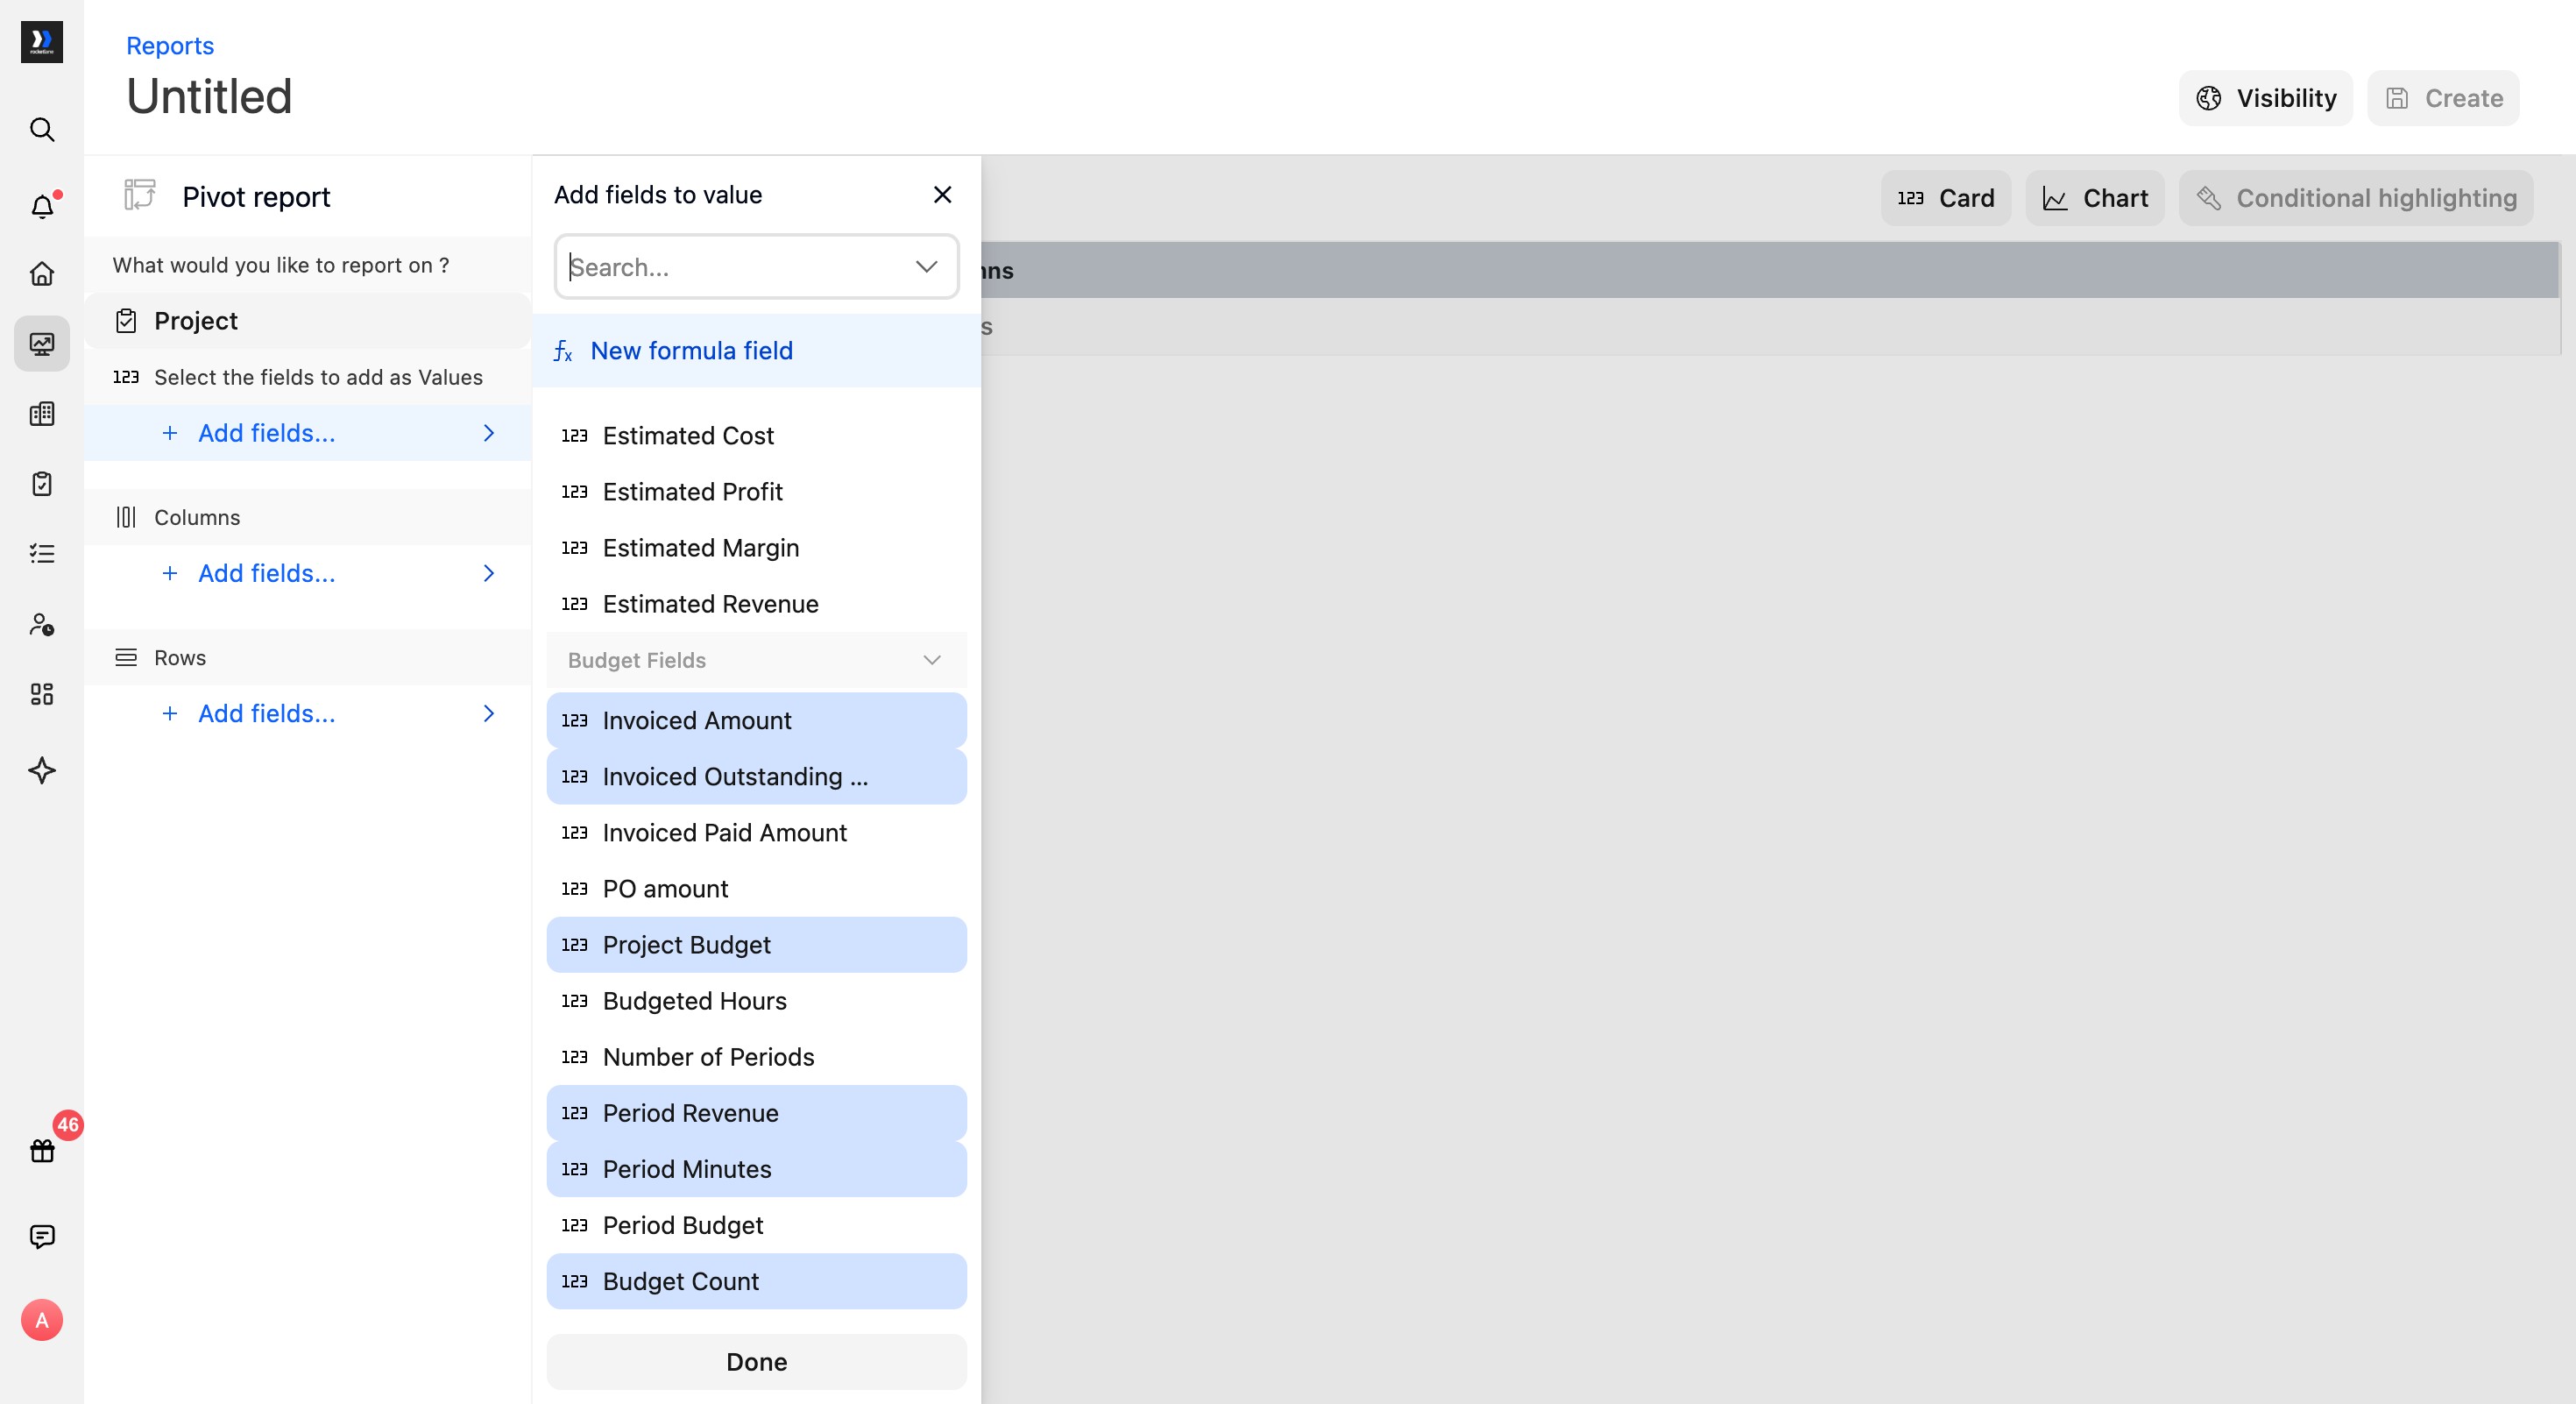
Select Done to display the summarized values.
Using Budget as the source
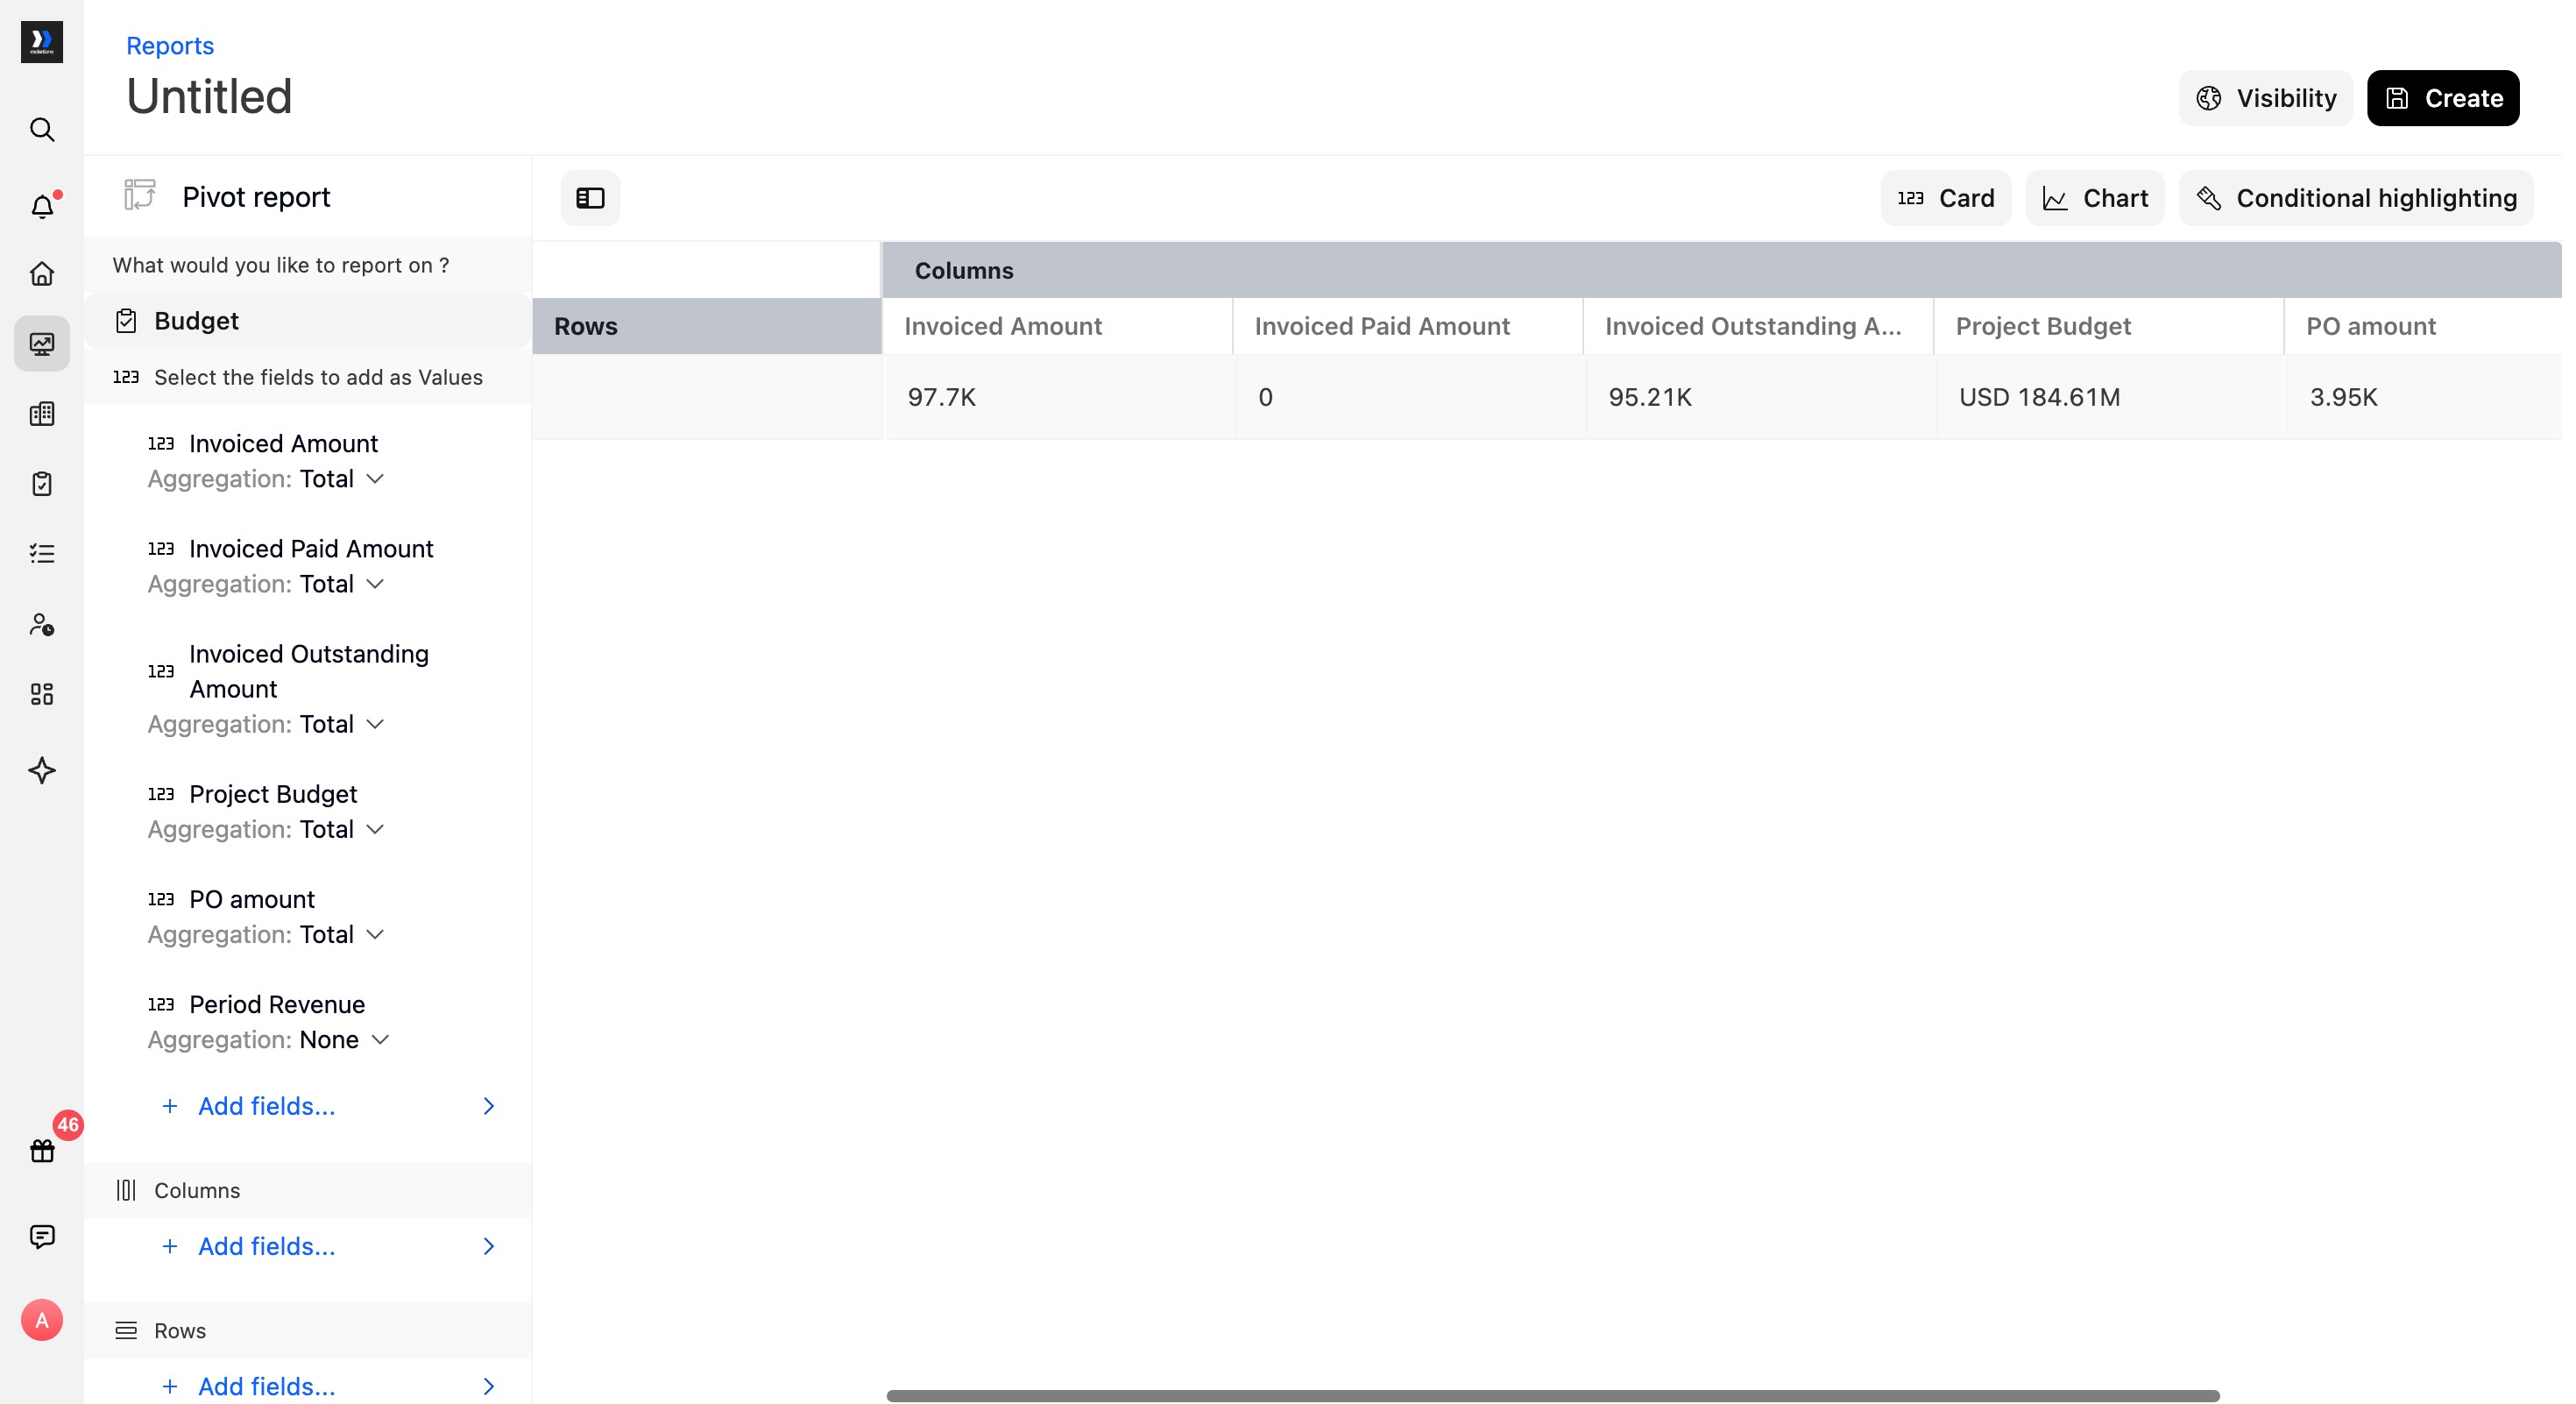
For budget-level analysis, change the report source to Budget.
- Under Values, select Add fields....
- Add the budget and financial metrics you want to summarize. These can include Invoiced Amount, Invoiced Paid Amount, Invoiced Outstanding Amount, Project Budget, PO amount, and Period Revenue.
- Select Done.
Other reporting options
The native Portfolio report can list projects with their budgets and display metrics for each budget alongside project totals. Use filters and groupings to analyze performance by budget, project, or company.