The Operations Insights Report lets you have an insight into the nitty-gritty of how projects, phases and tasks are being executed in your account. You can take a deep dive into each project, phase and task and view trends and charts that help you analyse what works for you and what needs improvement.
This report also draws comparisons between planned versus actual timelines to help you get a better idea of what is being completed ahead of time and what is lagging behind. View trends for specific time periods by applying relevant filters, compare data that has been statistically presented to you and find areas of excellence as well as improvement, all through the Operations Insights Report.

Operations Insights Report: The By Template Tab
This tab gives you an overview of the planned vs actual completion time, starting delays and ending delays of the projects that have been created using a certain template and also for their respective phases and tasks.
You can quickly identify both on-time completions and completion delays by glancing at the charts, graphs and tables in this tab.

Projects
Projects tab: Operations Insights Cards
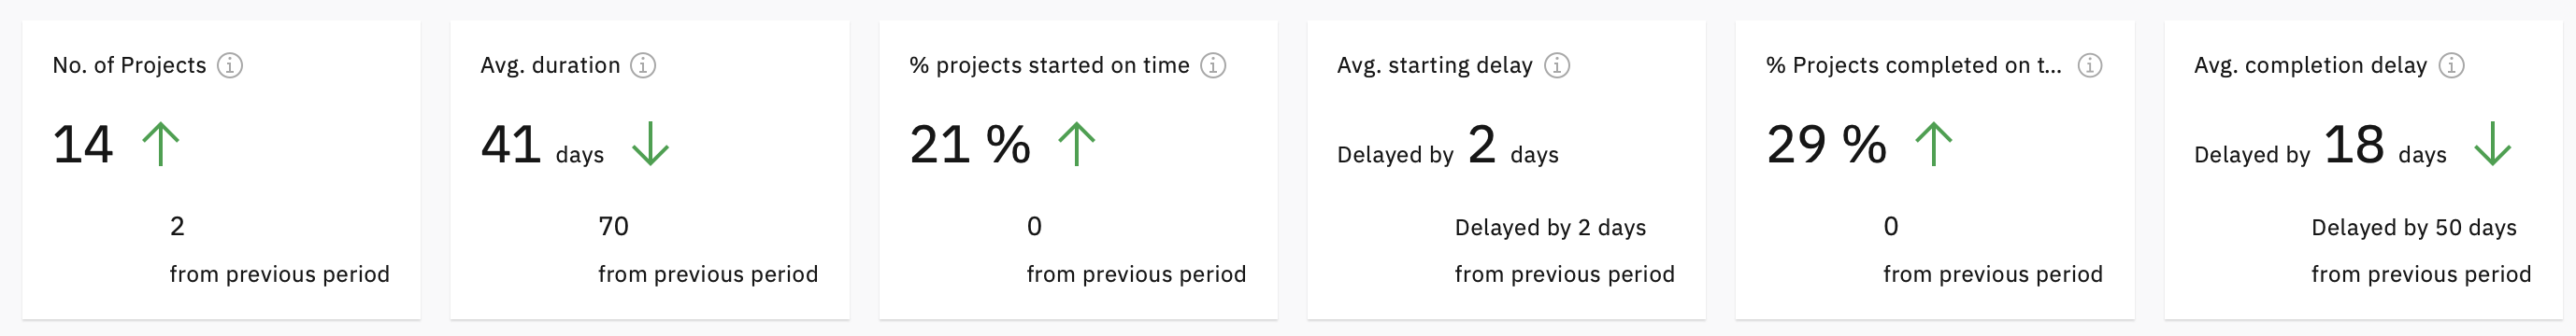
- No. of Projects
Number of Projects completed in the selected time period. - Avg. Duration
Average project duration in the selected period compared to the previous period. - % Projects Started on time
Percentage of projects that have been stated on the planned start date or earlier than that. - Avg. Starting Delay
Average difference between planned and actual start dates of projects. - % Projects completed on time
Percentage of projects that have been completed on the planned end date or earlier than that. - Avg. Completion Delay
Average difference between planned and actual end dates of projects.
Note: The up and down arrows with the cards indicate an increase/ decrease in the statistics compared to the previous time period that has been selected.
Project performance: Graph

This graph displays an overview for the trends of actual project duration compared to the planned duration.
The y-axis represents the average deviation from the planned duration (in days) and the x-axis represents the project creation date
Depending on the view you select, you can hover over the data points for each month/ week and get the number of projects created during that month/ week and the average deviation from the planned duration in number of days.
Monthly and Weekly views
You can switch between a month wise and week wise view for the distribution according to project creation dates.
Project Performance: Table

- Project Name
Name of the projects created using the template - Start date (Planned)
The start date mentioned while creating the project - Start Date (Actual)
The start date on which the project is marked as 'In progress' - Starting delay
Difference between planned and actual start dates - End date (Planned)
The end date mentioned while creating the project - End Date (Actual)
The end date on which the project is marked as 'Completed' - Completion delay
Difference between planned and actual end dates - Duration- Planned
Difference between planned end and start dates - Duration- Actual
Difference between actual end and start dates - Duration difference
Difference between planned and actual durations - Budgeted Hours
Number of budgeted hours allocated for the project - Total Tracked Hours
The total number of hours that have been tracked for the project - Hours difference
Difference between budgeted and tracked hours - Customer Name
The Name of the customer for the project - Status
Indicates the current status of the project - Project Owner
Indicates the team member that has been assigned as the Project Owner - Template
Indicates the template used to create the project - Last 5 Updates
Shows the last 5 Status Updates made from the project.
Phases
Phases tab: Operations Insights Cards

- % Phases Started on time
Percentage of phases that have been stated on the planned start date or earlier than that - Avg. Starting Delay
Average difference between planned and actual start dates of phases - % Phases completed on time
Percentage of phases that have been completed on the planned end date or earlier than that - Avg. Completion Delay
Average difference between planned and actual end dates of phases
Phase performance: Graph

This graph displays an overview for the trends of actual phase duration compared to the planned duration.
The y-axis represents the average deviation from the planned duration (in days) and the x-axis represents the phase creation date
Depending on the view you select, you can hover over the data points for each month/ week and get the number of phases created during that month/ week and the average deviation from the planned duration in number of days.
Monthly and Weekly views
You can switch between a month wise and week wise view for the distribution according to phase creation dates.

Phase Performance: Table
- Phases
Name of the phases created using the template - Planned Duration
The duration of each phase planned during template creation - Avg. Completion time
The average of the actual duration of the phase in projects - 50th %ile completion time
Indicates that 50% of all phases have been completed on or before this time duration - 90th %ile completion time
Indicates that 90% of all phases have been completed on or before this time duration - % phases completed late
Indicates the % of phases that have been completed later than the planned duration - CSAT
The average CSAT ratings received on tasks in the respective phase
Tasks

Tasks most frequently completed early: Table
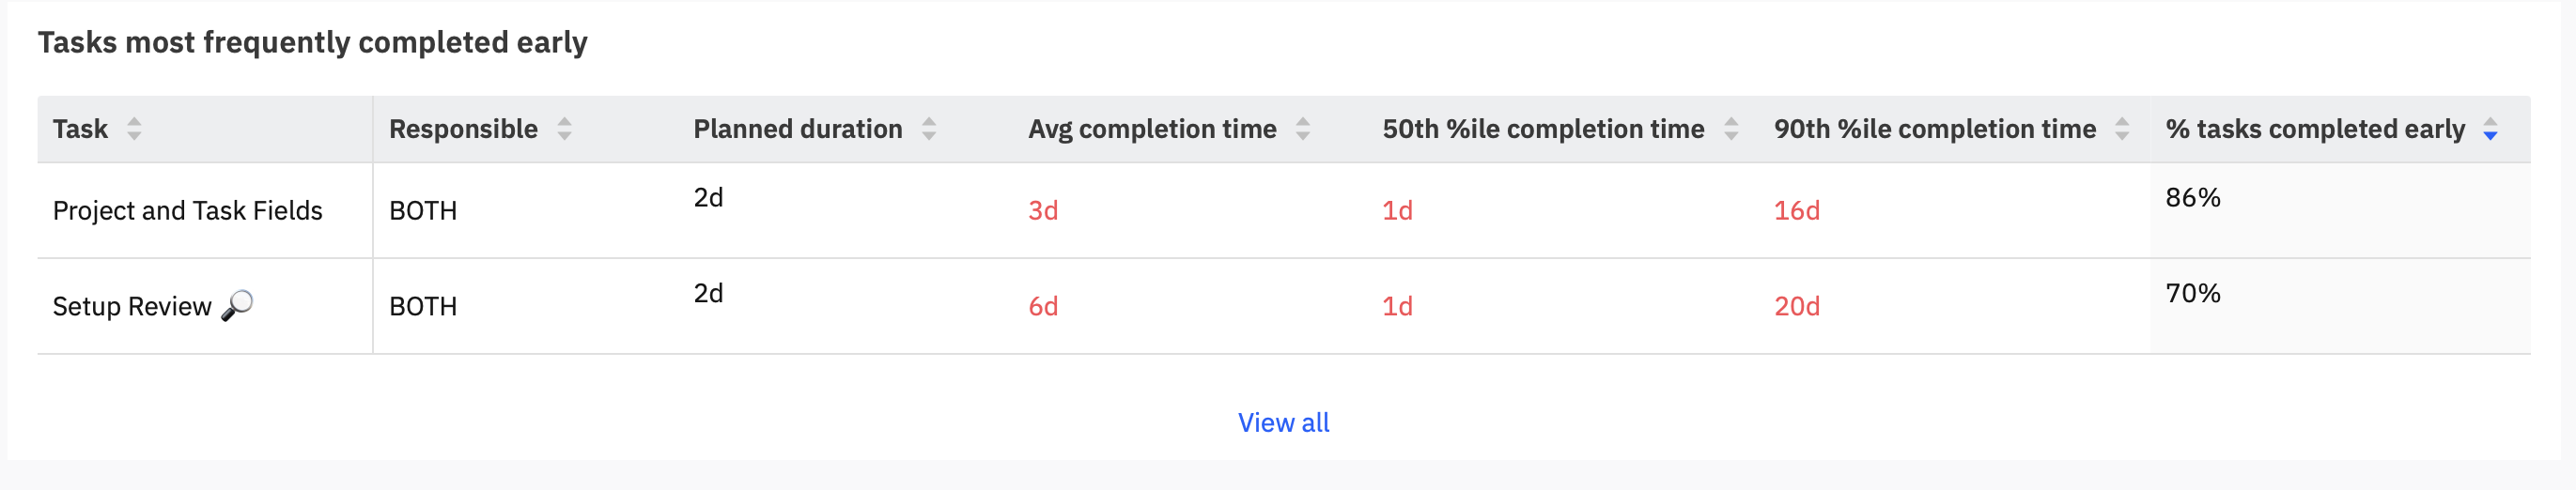
This table gives an overview of the tasks that have been completed earlier than the planned time in the template.
- Task
Name of the task - Responsible
Mentions if its your team or Customer's team or both teams which are responsible for the task - Planned Duration
The duration of the task as planned in the template - Average Completion Time
The average of all the completion times of the task in projects created using the template - 50th %ile Completion time
Indicates that 50% of all tasks have been completed on or before this time duration - 90th %ile Completion time
Indicates that 90% of all tasks have been completed on or before this time duration - % tasks Completed early
The percentage of tasks across all projects that have been completed earlier than the planned duration.
Tasks most frequently completed late: Table

This table gives an overview of the tasks that have been completed later than the planned time in the template.
- Task
Name of the task - Responsible
Mentions if its your team or Customer's team or both teams which are responsible for the task - Template
Name of the templates which the task belongs to - Planned Duration
The duration of the task in the template - Average Completion Time
The average of all the completion times of the task in projects created using the template - 50th %ile Completion time
Indicates that 50% of all tasks have been completed on or before this time duration - 90th %ile Completion time
Indicates that 90% of all tasks have been completed on or before this time duration - % tasks Completed late
The percentage of tasks that have been completed later than the planned duration
Tasks marked as blocked most frequently: Table

This table gives an overview of the tasks that have been marked as blocked.
- Task
Name of the task marked as Blocked - Responsible
Mentions if its your team or Customer's team or both teams which are responsible for the task - Template
Name of the templates which the task belongs to - Planned Duration
The duration of the task in the template - Average Completion Time
The average of all the completion times of the task in projects created using the template - % times marked
The percentage of times the task has been marked as blocked in a project - Number of times marked
The number of times the task has been marked as blocked.
Hey! Here's hoping that this support document was useful. You can write to us at care@rocketlane.com in case of any queries.